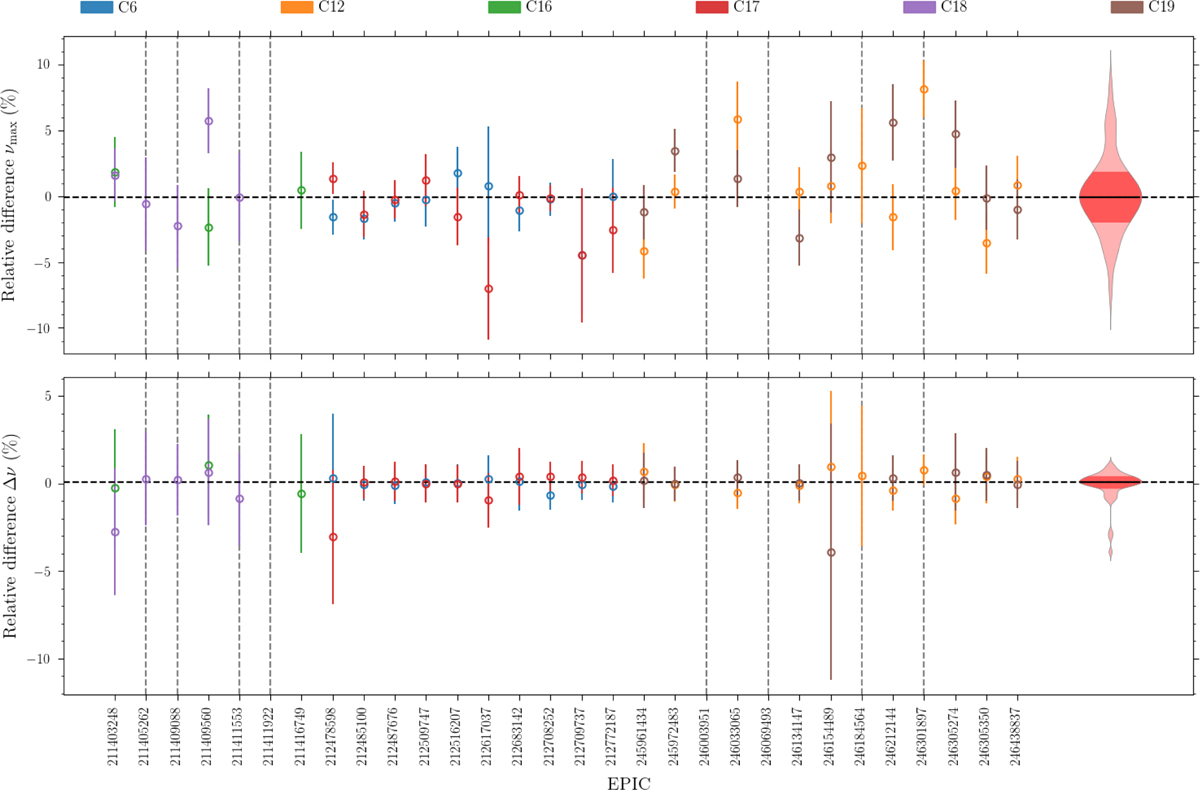
Fig. F.2
Download original image
Comparison for multi-campaign targets of measured νmax (top) and ∆ν (bottom) values from individual campaigns as compared to the value from the joint data. The values shown are based on the CV method. The colour indicates the campaign, and the horizontal dashed line indicates the median of the differences – the violin plot to the right shows the distribution of differences and indicates the 1 – σ spread (given by the standardised MAD). Vertical dashed lines indicate stars for which a detection was not obtained from a given or any of the single campaigns, but in all cases was obtained from the joint data.
Current usage metrics show cumulative count of Article Views (full-text article views including HTML views, PDF and ePub downloads, according to the available data) and Abstracts Views on Vision4Press platform.
Data correspond to usage on the plateform after 2015. The current usage metrics is available 48-96 hours after online publication and is updated daily on week days.
Initial download of the metrics may take a while.