Fig. 2
Download original image
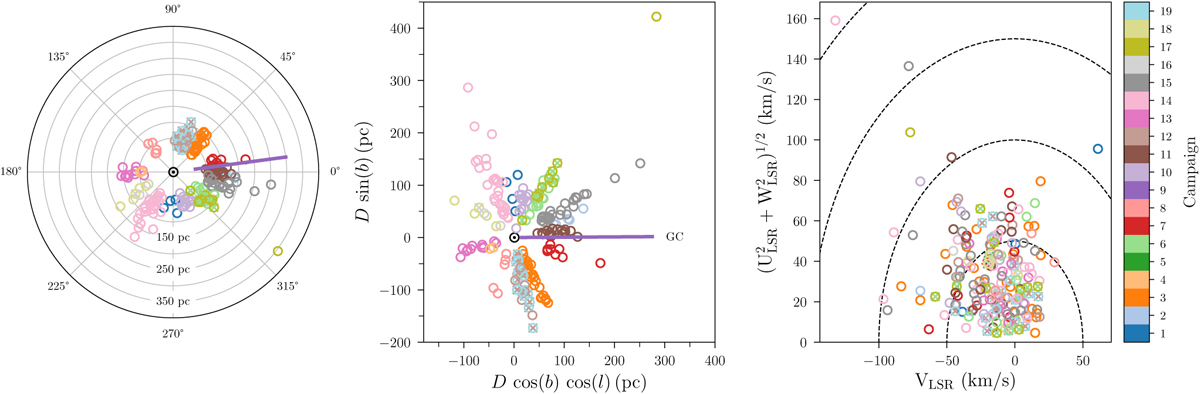
Sky positions and velocities in galactic coordinates of targets observed in C1–19 with positive seismic detections. We have generally adopted the photogeometric distances from Bailer-Jones et al. (2021), radial velocities from our SPC analysis (Sect. 4.1.1), and proper motions from Gaia EDR3 (Gaia Collaboration 2021). For targets with observations in more than one campaign, the targets will be indicated by crosses for one of these on top of the corresponding circular marker from the other observation campaign. We note that M67 targets, at a distance of ~800 pc from the Sun have been omitted from the figure. Left: Positions of targets in galactic longitude (l) and distance (D) from the Sun. The different colours indicate the K2 campaign (see colour bar in right panel). For C9, where no targets were proposed, we have indicated the direction with the coloured line. The galactic centre (GC) is in the direction of l = 0°. Middle: Positions projected in the abscissa onto the l = 180° → 0° line, with the direction of the GC to the right. Here b denotes the galactic latitude. Right: distribution of galactic velocities, using a local standard of rest (LSR) of (U, V, W) = (8.63, 4.76, 7.26) km s−1 (Ding et al. 2019). Dashed circles indicate total velocities in steps of 50 km s−1.
Current usage metrics show cumulative count of Article Views (full-text article views including HTML views, PDF and ePub downloads, according to the available data) and Abstracts Views on Vision4Press platform.
Data correspond to usage on the plateform after 2015. The current usage metrics is available 48-96 hours after online publication and is updated daily on week days.
Initial download of the metrics may take a while.