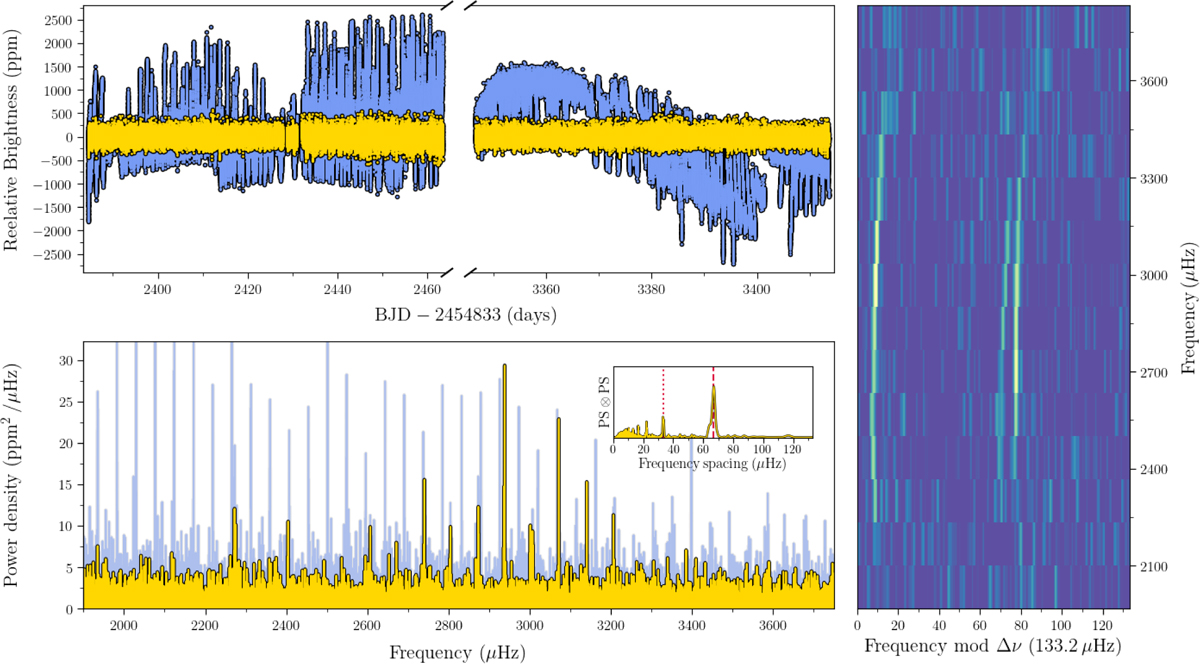
Fig. 3
Download original image
K2 photometry processing example for EPIC 212708252. Top left: light curve for EPIC 212708252 obtained during K2 C6 (left part) and C17 (right part). Blue points show the raw light curve as extracted from the target pixel files using custom apertures, while yellow points show the light curve after correcting for the K2 systematics. Bottom left: power density spectra for EPIC 212708252 as calculated from the raw (blue) and systematics-corrected (yellow) light curves. The insert shows the PS ⊗ PS of a region of the PDS centred on the measured νmax (~2900 µHz), where the dashed (dotted) line corresponds to the measured value for ∆ν/2 (∆ν/4). Right: the échelle diagram of EPIC 212708252.
Current usage metrics show cumulative count of Article Views (full-text article views including HTML views, PDF and ePub downloads, according to the available data) and Abstracts Views on Vision4Press platform.
Data correspond to usage on the plateform after 2015. The current usage metrics is available 48-96 hours after online publication and is updated daily on week days.
Initial download of the metrics may take a while.