Fig. 7
Download original image
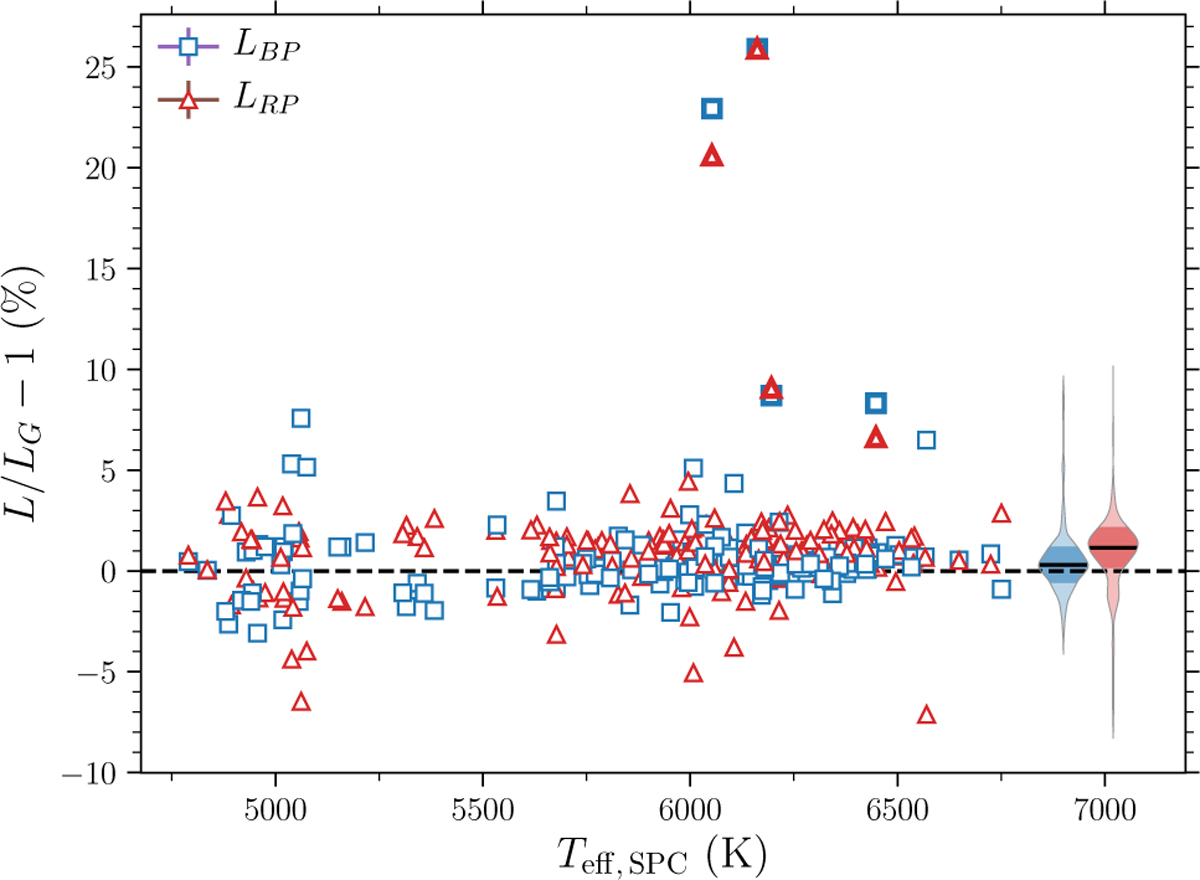
Relative differences as a function of Teff between luminosities calculated from the Gaia EDR3 BP and RP bands relative to those from the G-band. Spectroscopic values from SPC were used in the analysis. The violin inserts show the distributions of the relative differences, with the median indicated by a full black line and the standardised MAD by the darker-coloured interval. Markers with thick line widths show stars with a corrected version7of phot_bp_rp_excess_factor> 0.05 (see Riello et al. 2021), indicating potentially poor photometry.
Current usage metrics show cumulative count of Article Views (full-text article views including HTML views, PDF and ePub downloads, according to the available data) and Abstracts Views on Vision4Press platform.
Data correspond to usage on the plateform after 2015. The current usage metrics is available 48-96 hours after online publication and is updated daily on week days.
Initial download of the metrics may take a while.