Fig. 1
Download original image
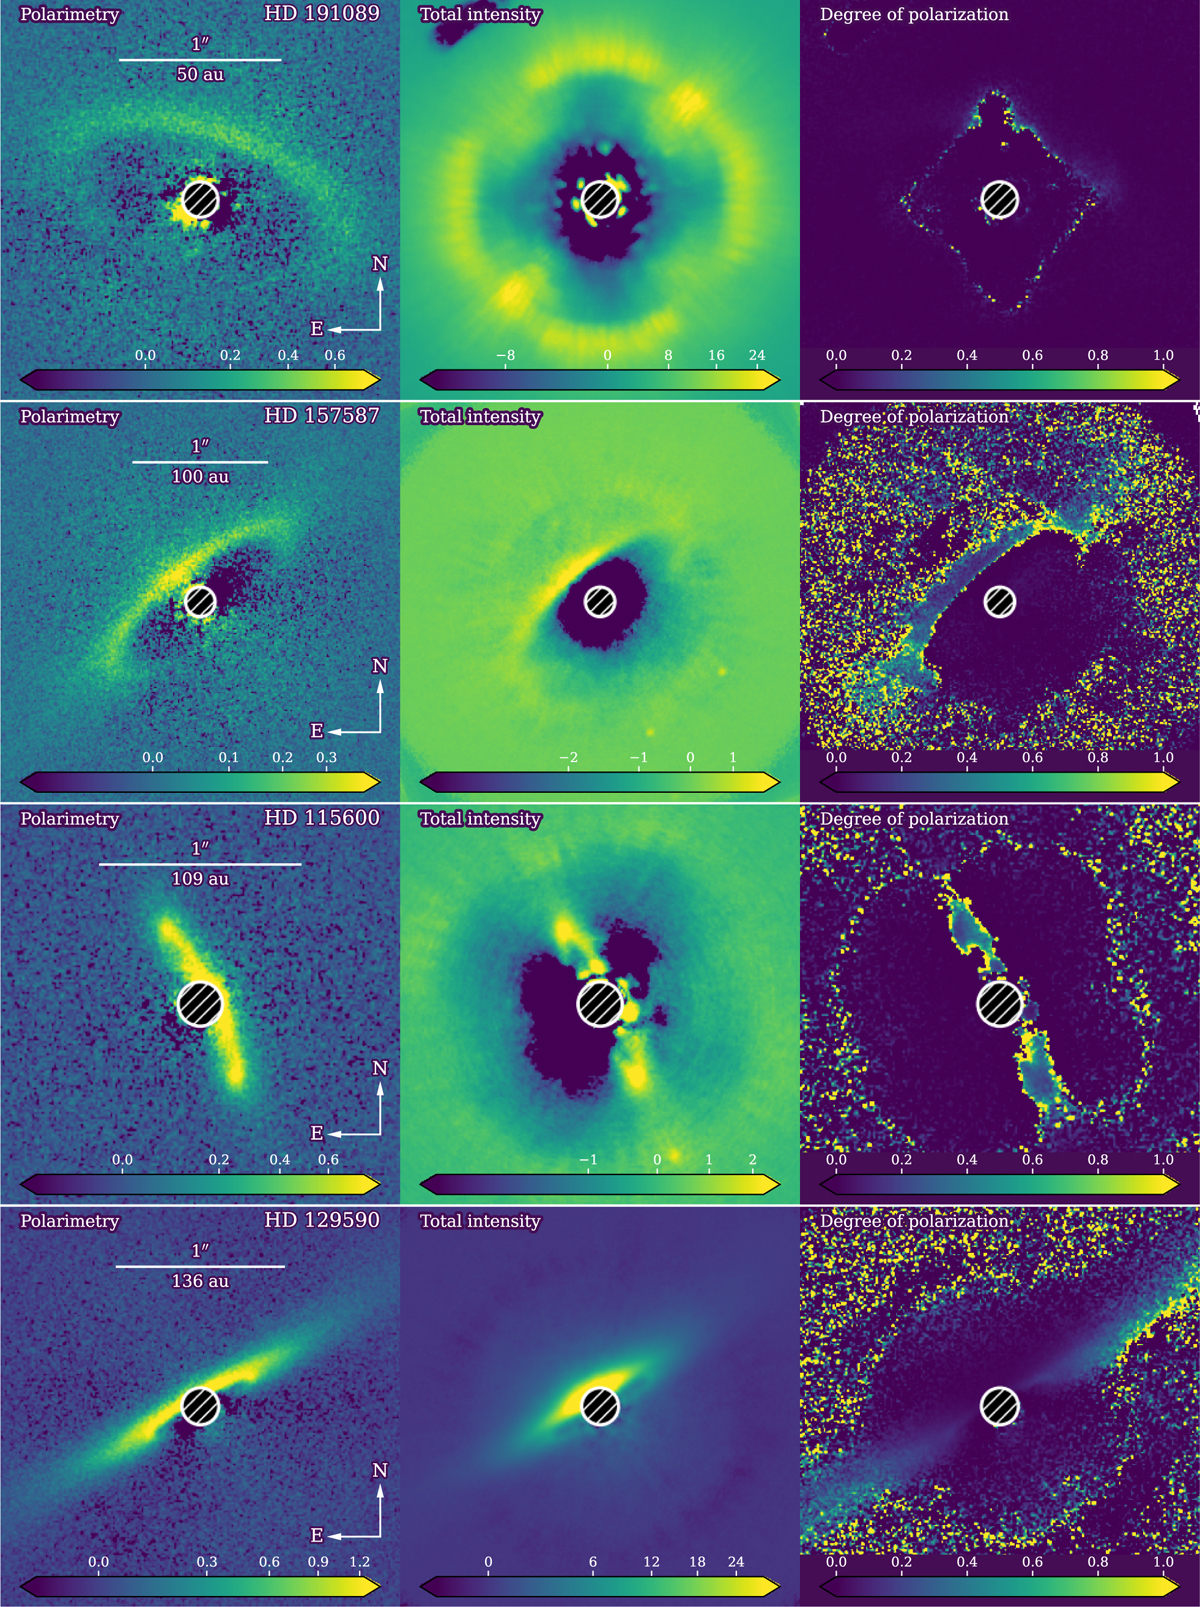
Observations of HD 191089, HD 157587, HD 115600, and HD 129590 (from top to bottom, respectively). The left subpanel shows the polarimetric observations, the central subpanel shows the total intensity, while the right subpanel shows the degree of polarization (polarimetry over total intensity). The scaling is linear for the right panels and between 0 and 1. For the left and center panels, the scaling is in square root. On the left panel, the horizontal bar represents 1″ and the distance in au is reported below. North is up, east is to the right, as indicated by the compass on the leftmost panels.
Current usage metrics show cumulative count of Article Views (full-text article views including HTML views, PDF and ePub downloads, according to the available data) and Abstracts Views on Vision4Press platform.
Data correspond to usage on the plateform after 2015. The current usage metrics is available 48-96 hours after online publication and is updated daily on week days.
Initial download of the metrics may take a while.