Open Access
Fig. A.1
Download original image
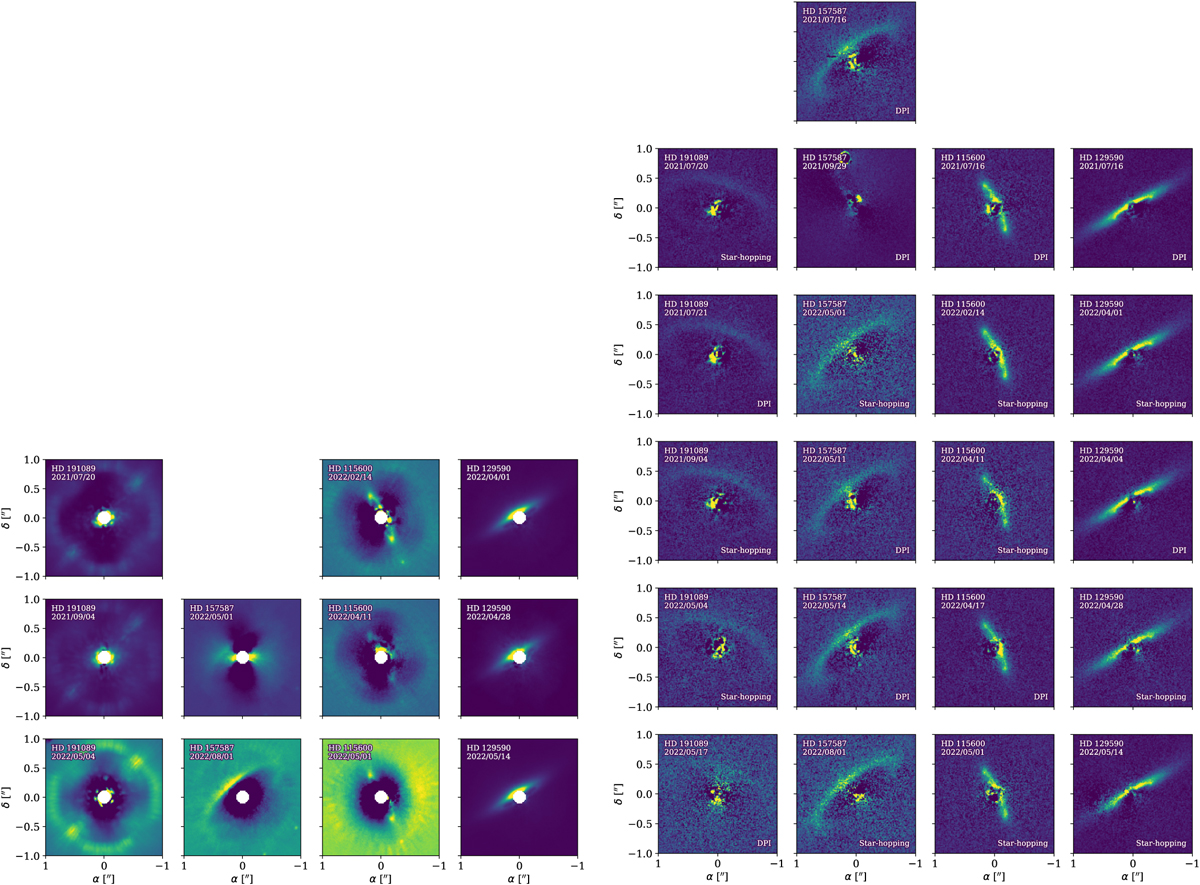
Gallery of the final data products for all the epochs listed in Table A.1. The four columns on the left are for total intensity observations, the four on the right are for polarized intensity.
Current usage metrics show cumulative count of Article Views (full-text article views including HTML views, PDF and ePub downloads, according to the available data) and Abstracts Views on Vision4Press platform.
Data correspond to usage on the plateform after 2015. The current usage metrics is available 48-96 hours after online publication and is updated daily on week days.
Initial download of the metrics may take a while.