Fig. B.1
Download original image
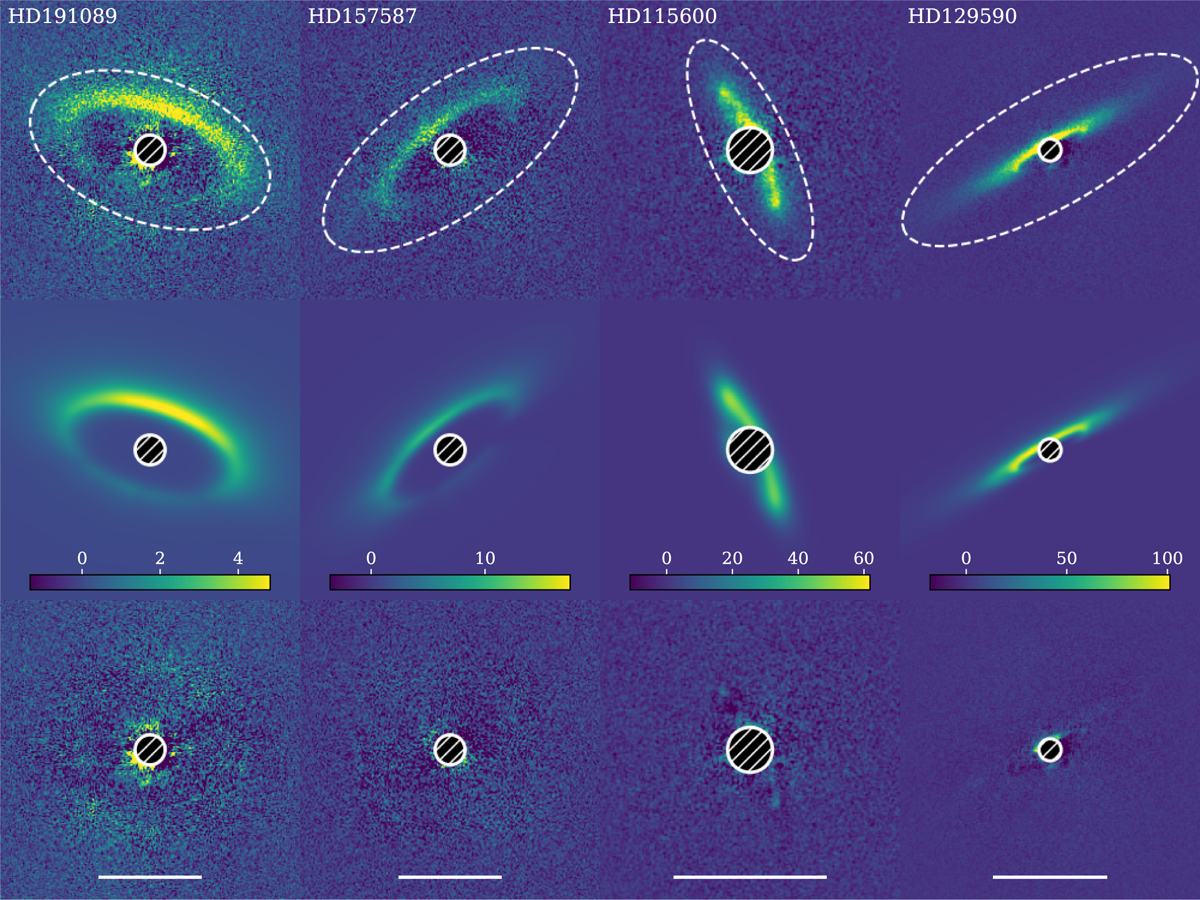
Modeling results for the four debris disks discussed in this study. The Qϕ image (the ellipse represents where the goodness of fit is estimated), best fit model, and residuals are shown from top to bottom. From left to right, the stars are HD 191089, HD 157587, HD 115600, and HD 129590 (same as in Olofsson et al. 2022b for the latter two stars). The scaling is linear and the same for each column (colorbar shown in the middle panel). The horizontal bar in the bottom panel represents 1″.
Current usage metrics show cumulative count of Article Views (full-text article views including HTML views, PDF and ePub downloads, according to the available data) and Abstracts Views on Vision4Press platform.
Data correspond to usage on the plateform after 2015. The current usage metrics is available 48-96 hours after online publication and is updated daily on week days.
Initial download of the metrics may take a while.