Fig. 1.
Download original image
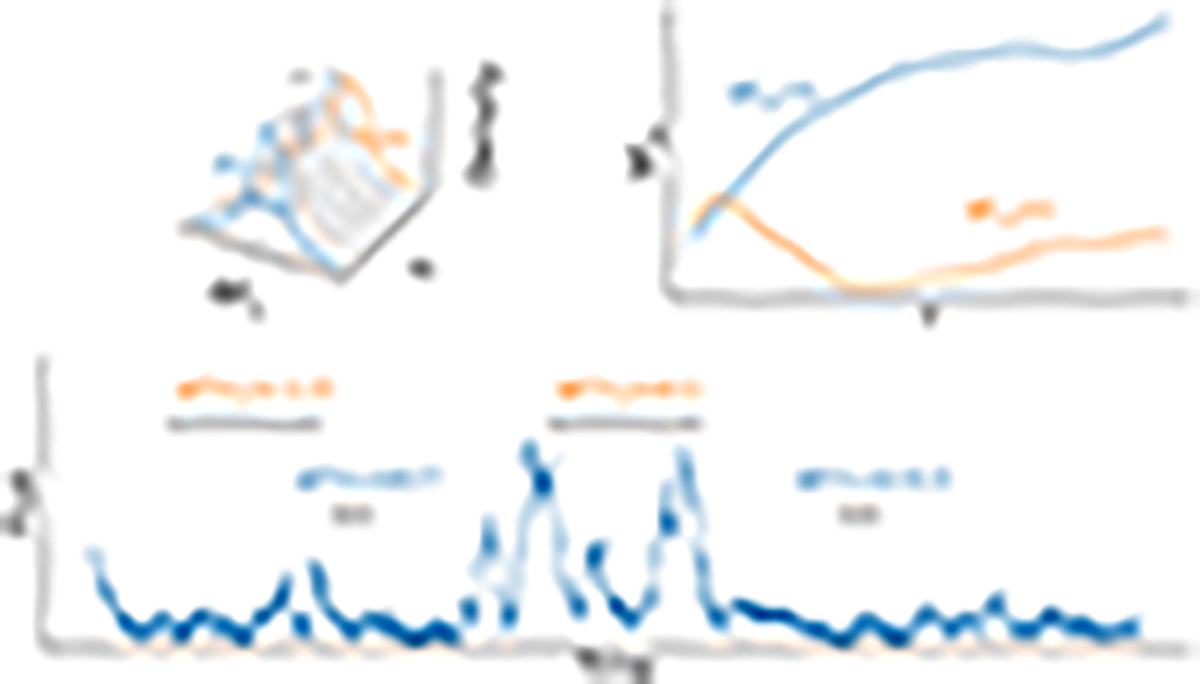
Cartoon showing the concept of moment-based summary statistics for light-curve analysis. The bottom panel shows an example light curve. The orange and blue annotation indicates the flux differences for two given time lags, τ1 and τ2. The top panel shows the histogram of flux differences for every time lag, τi. Each histogram has its respective statistical moments: mean (μ1), variance (μ2), and skewness (μ3). At the upper right, variance and skewness are plotted as functions of time lag.
Current usage metrics show cumulative count of Article Views (full-text article views including HTML views, PDF and ePub downloads, according to the available data) and Abstracts Views on Vision4Press platform.
Data correspond to usage on the plateform after 2015. The current usage metrics is available 48-96 hours after online publication and is updated daily on week days.
Initial download of the metrics may take a while.