Fig. A.2.
Download original image
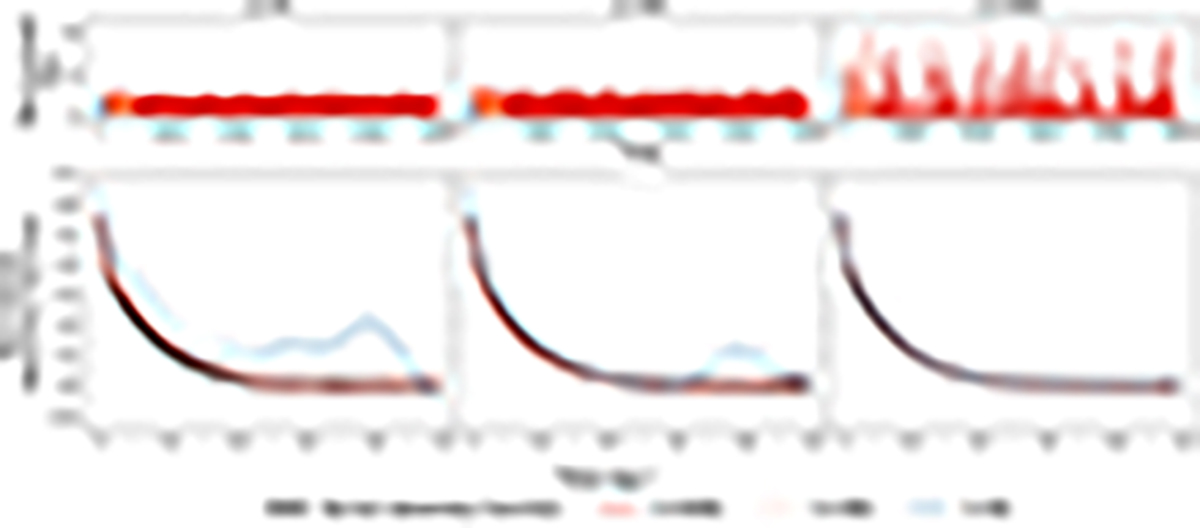
Simulated light curves and derived structure functions. Upper panels: Light curves for different values of α (Equation 9) as labeled. The light curves were generated by the MA model (Equation 7) and include random and correlated noise with the random seed the same for all panels. The kernels are double-exponential profiles (Equation 10), and the innovation R = Uα was drawn from uniformly distributed samples in [0, 1). Colors at the left mark sections of the light curve with 5 000 and 50 000 samples with the full curves containing 500 000. Lower panels: Structure functions of the simulated light curve above each panel. The black curve shows the true structure function without noise. The colored curves show the structure function derived from each light curve with a finite number of samples as labeled.
Current usage metrics show cumulative count of Article Views (full-text article views including HTML views, PDF and ePub downloads, according to the available data) and Abstracts Views on Vision4Press platform.
Data correspond to usage on the plateform after 2015. The current usage metrics is available 48-96 hours after online publication and is updated daily on week days.
Initial download of the metrics may take a while.