Fig. 4.
Download original image
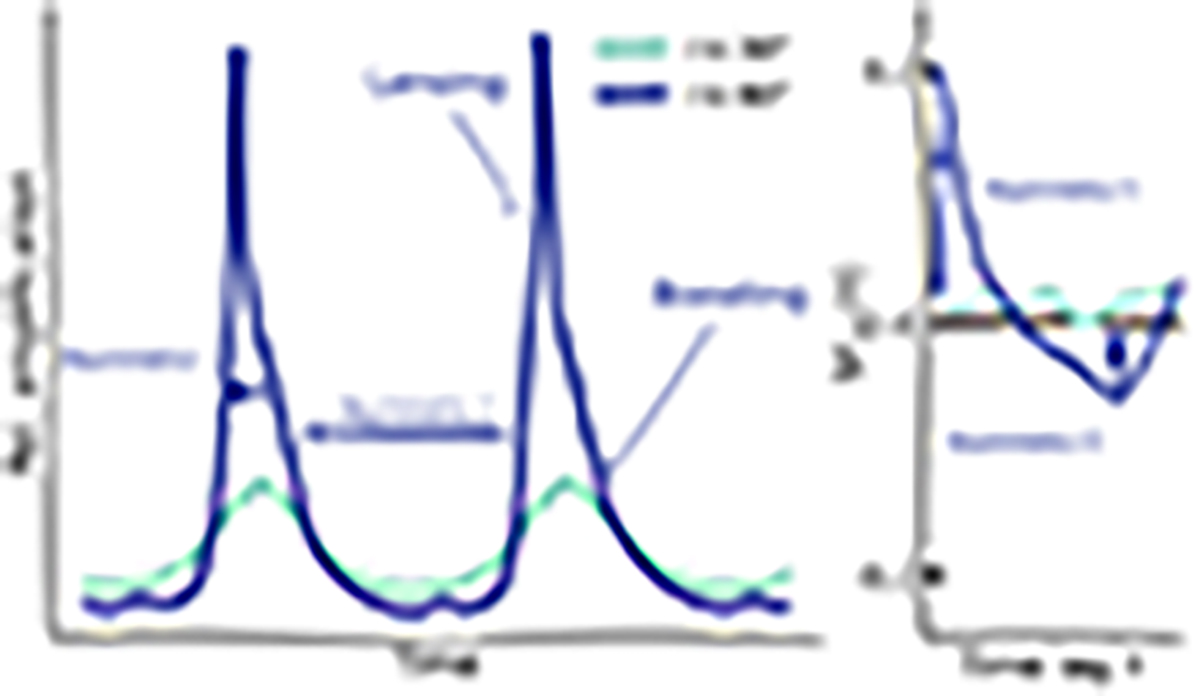
Relativistic magnification in Sgr A*’s light curve. The left graph shows the magnification kernel computed from a library of ray-traced images GRAVITY Collaboration (2020b) for two different inclination angles, as is indicated by the line colors. The time interval plotted is two orbits. Both lensing and boosting peak at the orbit phase near 1.5π (Hamaus et al. 2009). The right graph shows SFμ3(τ) computed for each magnification curve using Equation (13).
Current usage metrics show cumulative count of Article Views (full-text article views including HTML views, PDF and ePub downloads, according to the available data) and Abstracts Views on Vision4Press platform.
Data correspond to usage on the plateform after 2015. The current usage metrics is available 48-96 hours after online publication and is updated daily on week days.
Initial download of the metrics may take a while.