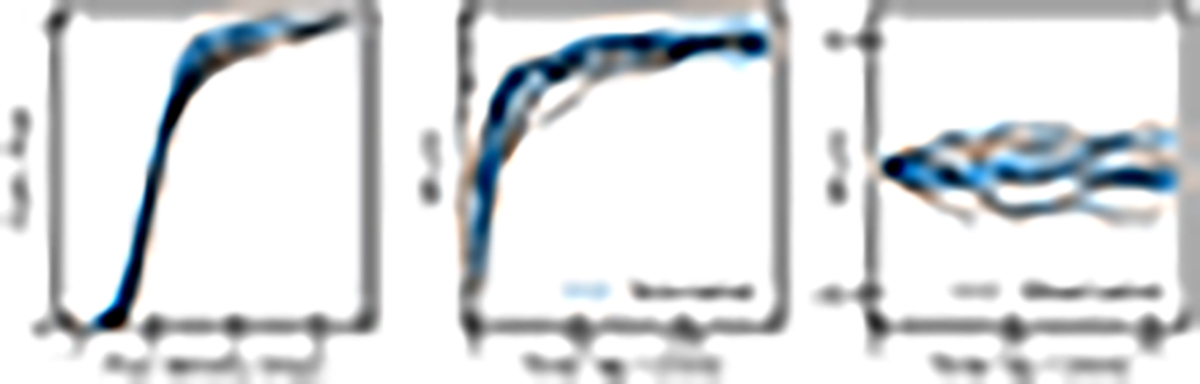
Fig. 5.
Download original image
Summary statistics from posterior samples (blue) of the converged model fit compared to real observations (black). Statistics are shown separately for the eight observed light curves. The left panel shows the cumulative flux-density distribution, and the other two panels show the two structure-function distributions, as is labeled.
Current usage metrics show cumulative count of Article Views (full-text article views including HTML views, PDF and ePub downloads, according to the available data) and Abstracts Views on Vision4Press platform.
Data correspond to usage on the plateform after 2015. The current usage metrics is available 48-96 hours after online publication and is updated daily on week days.
Initial download of the metrics may take a while.