Fig. 6.
Download original image
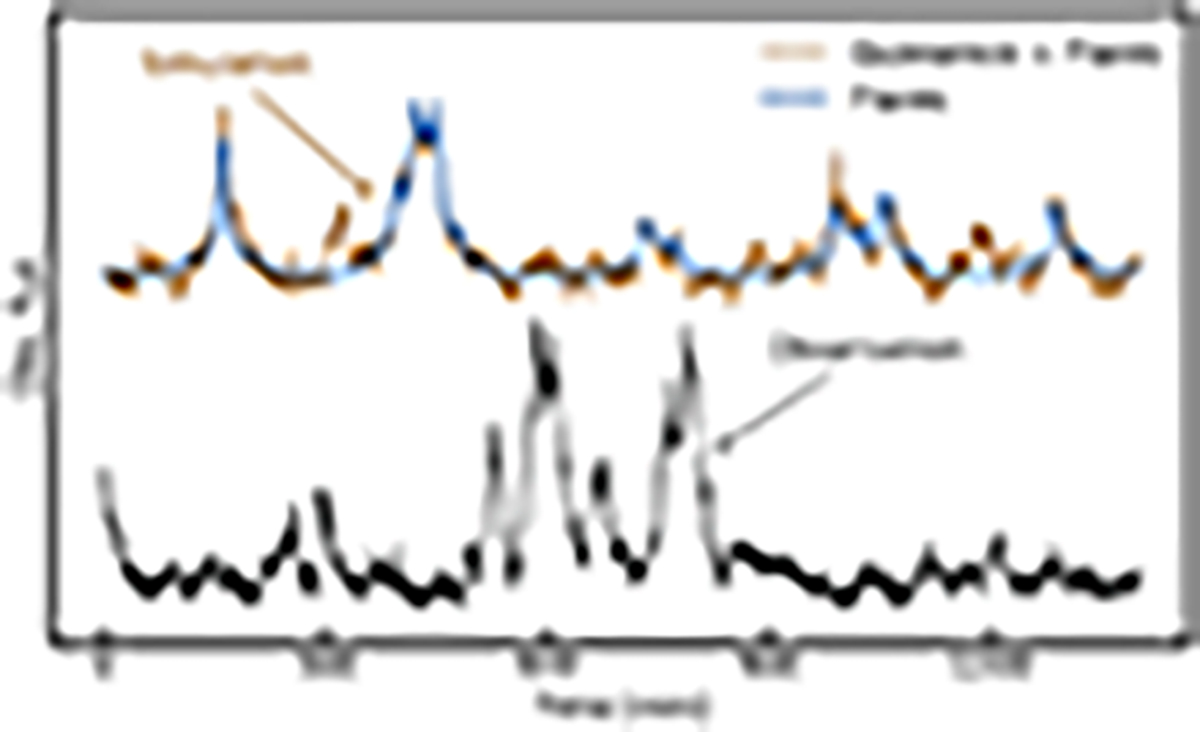
Simulated light curve draw from the model posterior compared to a differential light curve measured by Spitzer. The blue line shows simulated flares (first part in Equation (13)) drawn from the flare-model posterior. The brown line shows the full model light curve including the quiescence emission and observational noise, and the black line shows a Spitzer observation. The curves are vertically offset for clarity, but the y axis has the same linear scale for both curves.
Current usage metrics show cumulative count of Article Views (full-text article views including HTML views, PDF and ePub downloads, according to the available data) and Abstracts Views on Vision4Press platform.
Data correspond to usage on the plateform after 2015. The current usage metrics is available 48-96 hours after online publication and is updated daily on week days.
Initial download of the metrics may take a while.