Open Access
Fig. 8.
Download original image
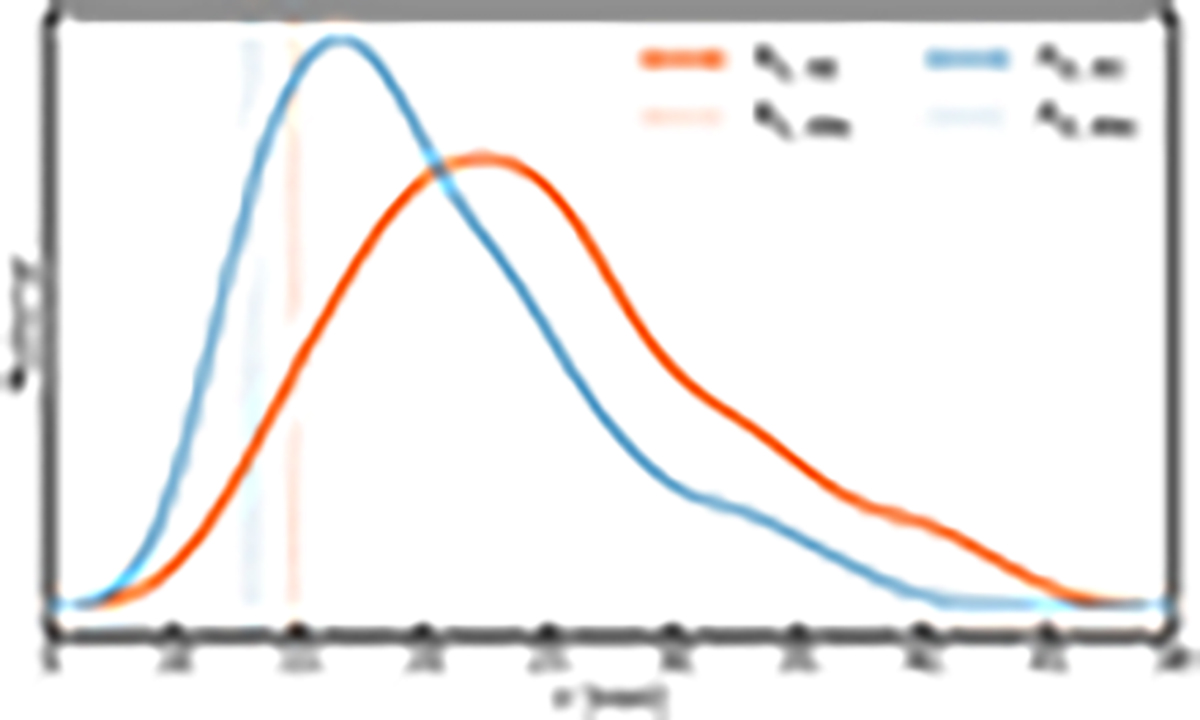
Posteriors of intrinsic timescales. Colored curves show posteriors of τ1,int (orange) and τ2,int (blue) derived from fitting the relativistic model. Vertical dashed lines show the timescales (τ1,obs and τ2,obs, colors as labeled) in the observed light curves as derived from fitting the MA model.
Current usage metrics show cumulative count of Article Views (full-text article views including HTML views, PDF and ePub downloads, according to the available data) and Abstracts Views on Vision4Press platform.
Data correspond to usage on the plateform after 2015. The current usage metrics is available 48-96 hours after online publication and is updated daily on week days.
Initial download of the metrics may take a while.