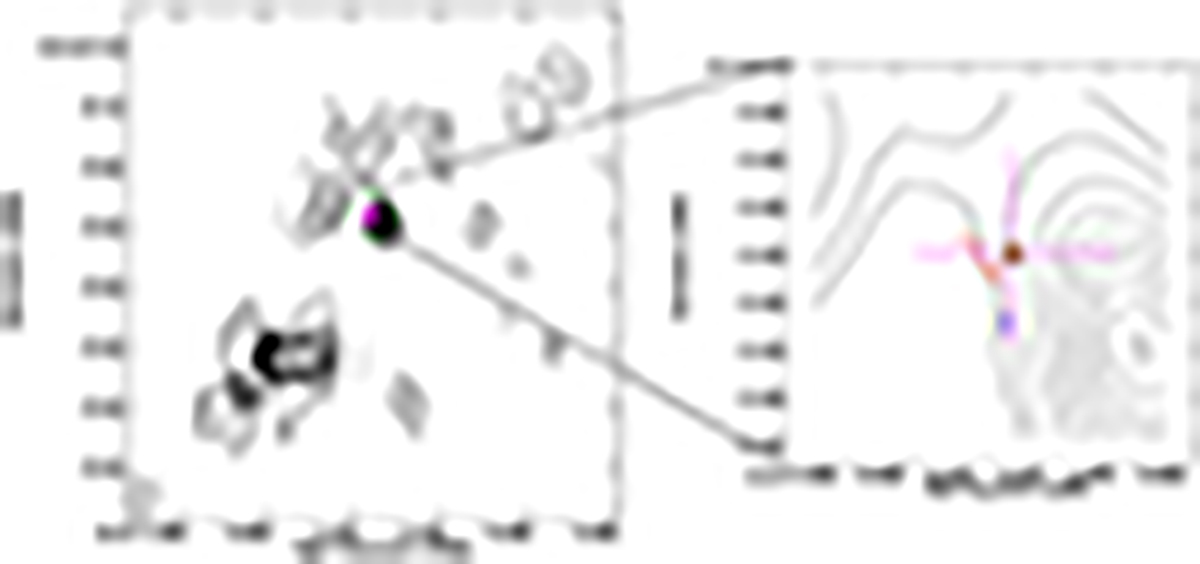
Fig. 4.
Download original image
Adaption of Fig. 9 in Surcis et al. (2020) with the (coincident) positions of the maser emission at 183 and 380 GHz (magenta cross) overlaid on the VLBI contour map of the L-band continuum emission in TXS 2226 (Taylor et al. 2004). The size of the magenta cross (solid and dashed, in the left and right panel, respectively) is comparable with the absolute astrometric precision estimated for our ALMA observations (∼10 mas; see Sect. 4.2). The size of the brown cross in the right panel is the relative position uncertainty of the (sub)millimeter masers (1 mas; Sect. 4.2). The red and blue crosses are the 22 GHz maser spots detected through VLBA measurements (for details, see Surcis et al. 2020, and references therein).
Current usage metrics show cumulative count of Article Views (full-text article views including HTML views, PDF and ePub downloads, according to the available data) and Abstracts Views on Vision4Press platform.
Data correspond to usage on the plateform after 2015. The current usage metrics is available 48-96 hours after online publication and is updated daily on week days.
Initial download of the metrics may take a while.