Fig. 1
Download original image
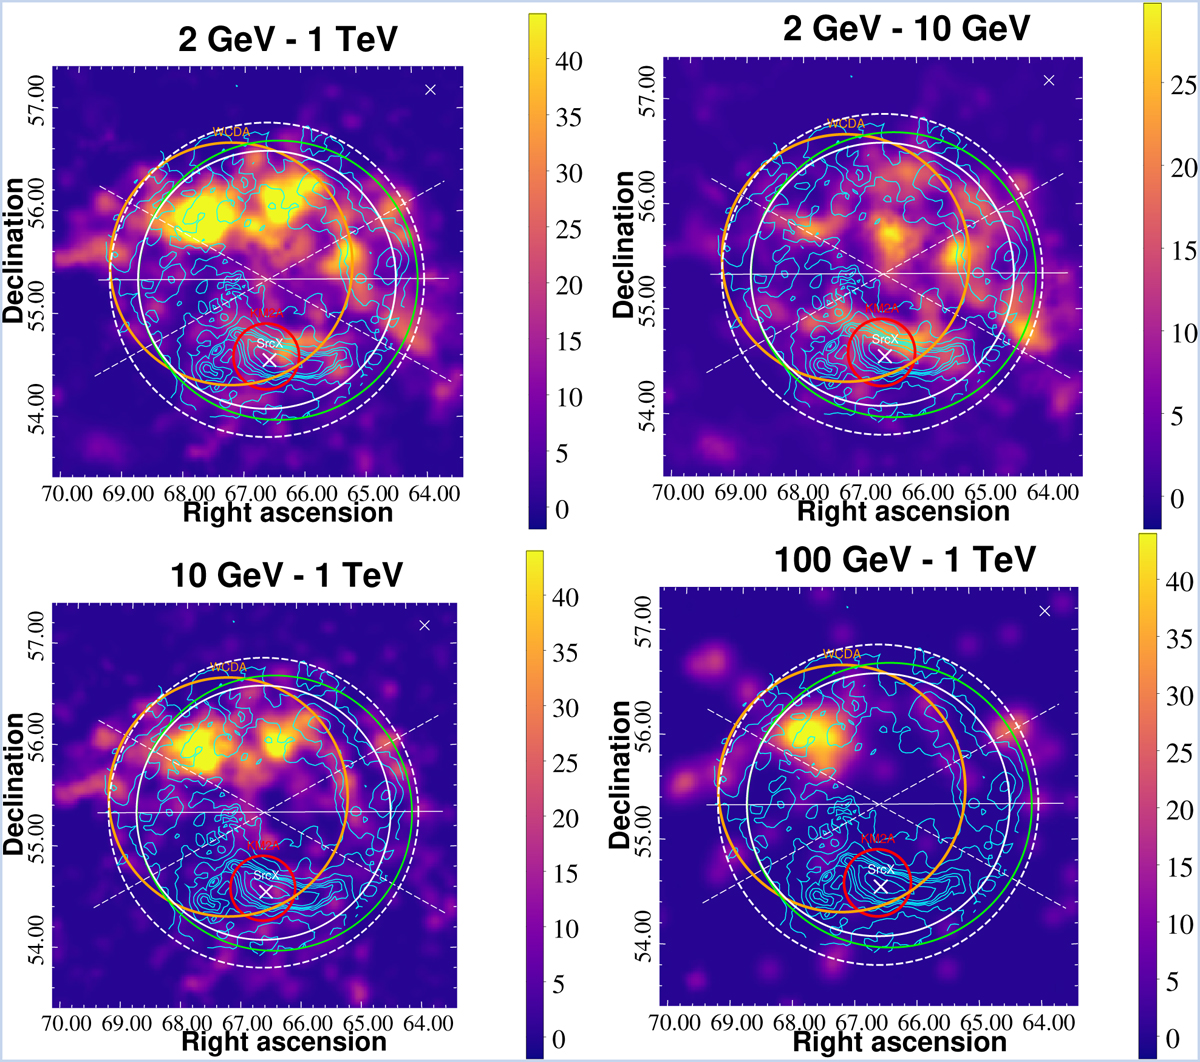
TS maps in the vicinity of SNR G150.3+4.5 observed with the Fermi-LAT. All figures are generated with square bins of 0.02°. The energy ranges are indicated above the panels. The green circle represents the best-fit 2D Gaussian template from Devin et al. (2020). The white solid and dashed circles show the R68 and radius of the uniform disk model in this work, which is separated by the white horizontal line into two half-spheres: northlobe and southlobe (models 8 & 11 & 12). The white dashed line corresponds to the +30° and −30° scenarios (models 9 and 10). The unnamed white cross in the upper right corner represents a background point source from 4FGL-DR3 (Abdollahi et al. 2020, 2022) and SrcX represents the point source 4FGL J0426.5+5434, which has been treated as a distinct background point source. The cyan contours are extracted from Urumqi λ6 cm results (Gao & Han 2014), showing the complete shell structure. The red and orange circles are R39(σ) size for the LHAASO KM2A and WCDA sources (Cao et al. 2024), respectively.
Current usage metrics show cumulative count of Article Views (full-text article views including HTML views, PDF and ePub downloads, according to the available data) and Abstracts Views on Vision4Press platform.
Data correspond to usage on the plateform after 2015. The current usage metrics is available 48-96 hours after online publication and is updated daily on week days.
Initial download of the metrics may take a while.