Fig. 3
Download original image
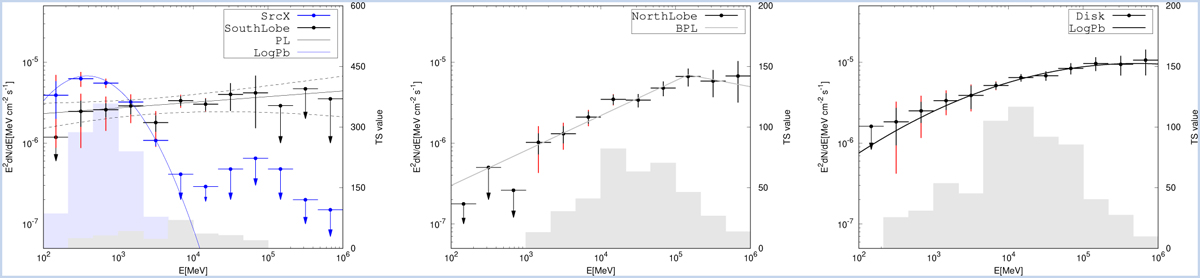
SED and TS values (shaded areas) of the southlobe/SrcX (panel left), northlobe (panel middle), and disk (panel right) as measured by Fermi-LAT in the energy range from 0.1 to 1000 GeV. Upper limit are calculated at 95% confidence level using a Bayesian method for points with TS values less than 5. The statistical errors are shown in black/blue error bars, while the sum of statistical and systematic errors calculated by ![]() are marked by red error bars. The disk and SrcX can be described with a log-parabola spectrum. The northlobe is best-fitted with a broken power-law spectrum. The southlobe is compatible with a single power law and the black dash lines show the 1 σ statistic error uncertainty.
are marked by red error bars. The disk and SrcX can be described with a log-parabola spectrum. The northlobe is best-fitted with a broken power-law spectrum. The southlobe is compatible with a single power law and the black dash lines show the 1 σ statistic error uncertainty.
Current usage metrics show cumulative count of Article Views (full-text article views including HTML views, PDF and ePub downloads, according to the available data) and Abstracts Views on Vision4Press platform.
Data correspond to usage on the plateform after 2015. The current usage metrics is available 48-96 hours after online publication and is updated daily on week days.
Initial download of the metrics may take a while.