Fig. B1
Download original image
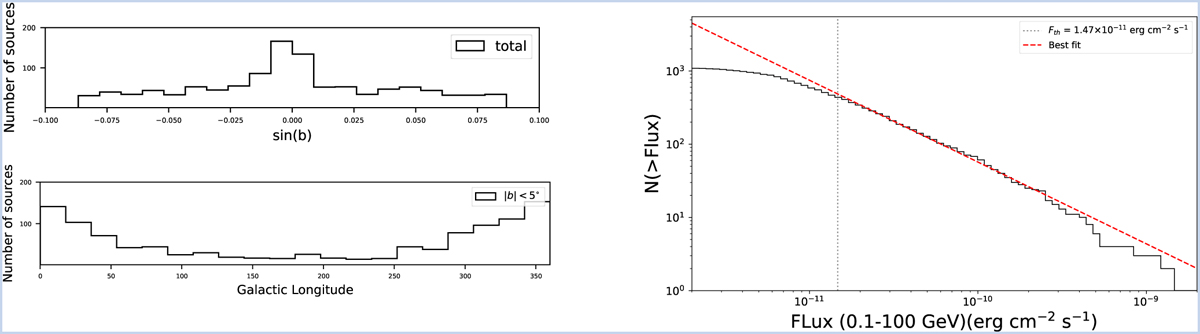
4FGL source number distribution in galactic latitude (b) shown in the top-left panel. Bottom left panel: 4FGL source number distribution in galactic longitude for |b| < 5°. Right panel: Cumulative numbers of sources and the threshold fluxes for LAT 4FGL sources (histograms) with the power-law fitting results of their high-flux trends (red dashed line). The grey dotted line represents for the 95% upper limit obtained from flux analysis in Sect. 2.3.
Current usage metrics show cumulative count of Article Views (full-text article views including HTML views, PDF and ePub downloads, according to the available data) and Abstracts Views on Vision4Press platform.
Data correspond to usage on the plateform after 2015. The current usage metrics is available 48-96 hours after online publication and is updated daily on week days.
Initial download of the metrics may take a while.