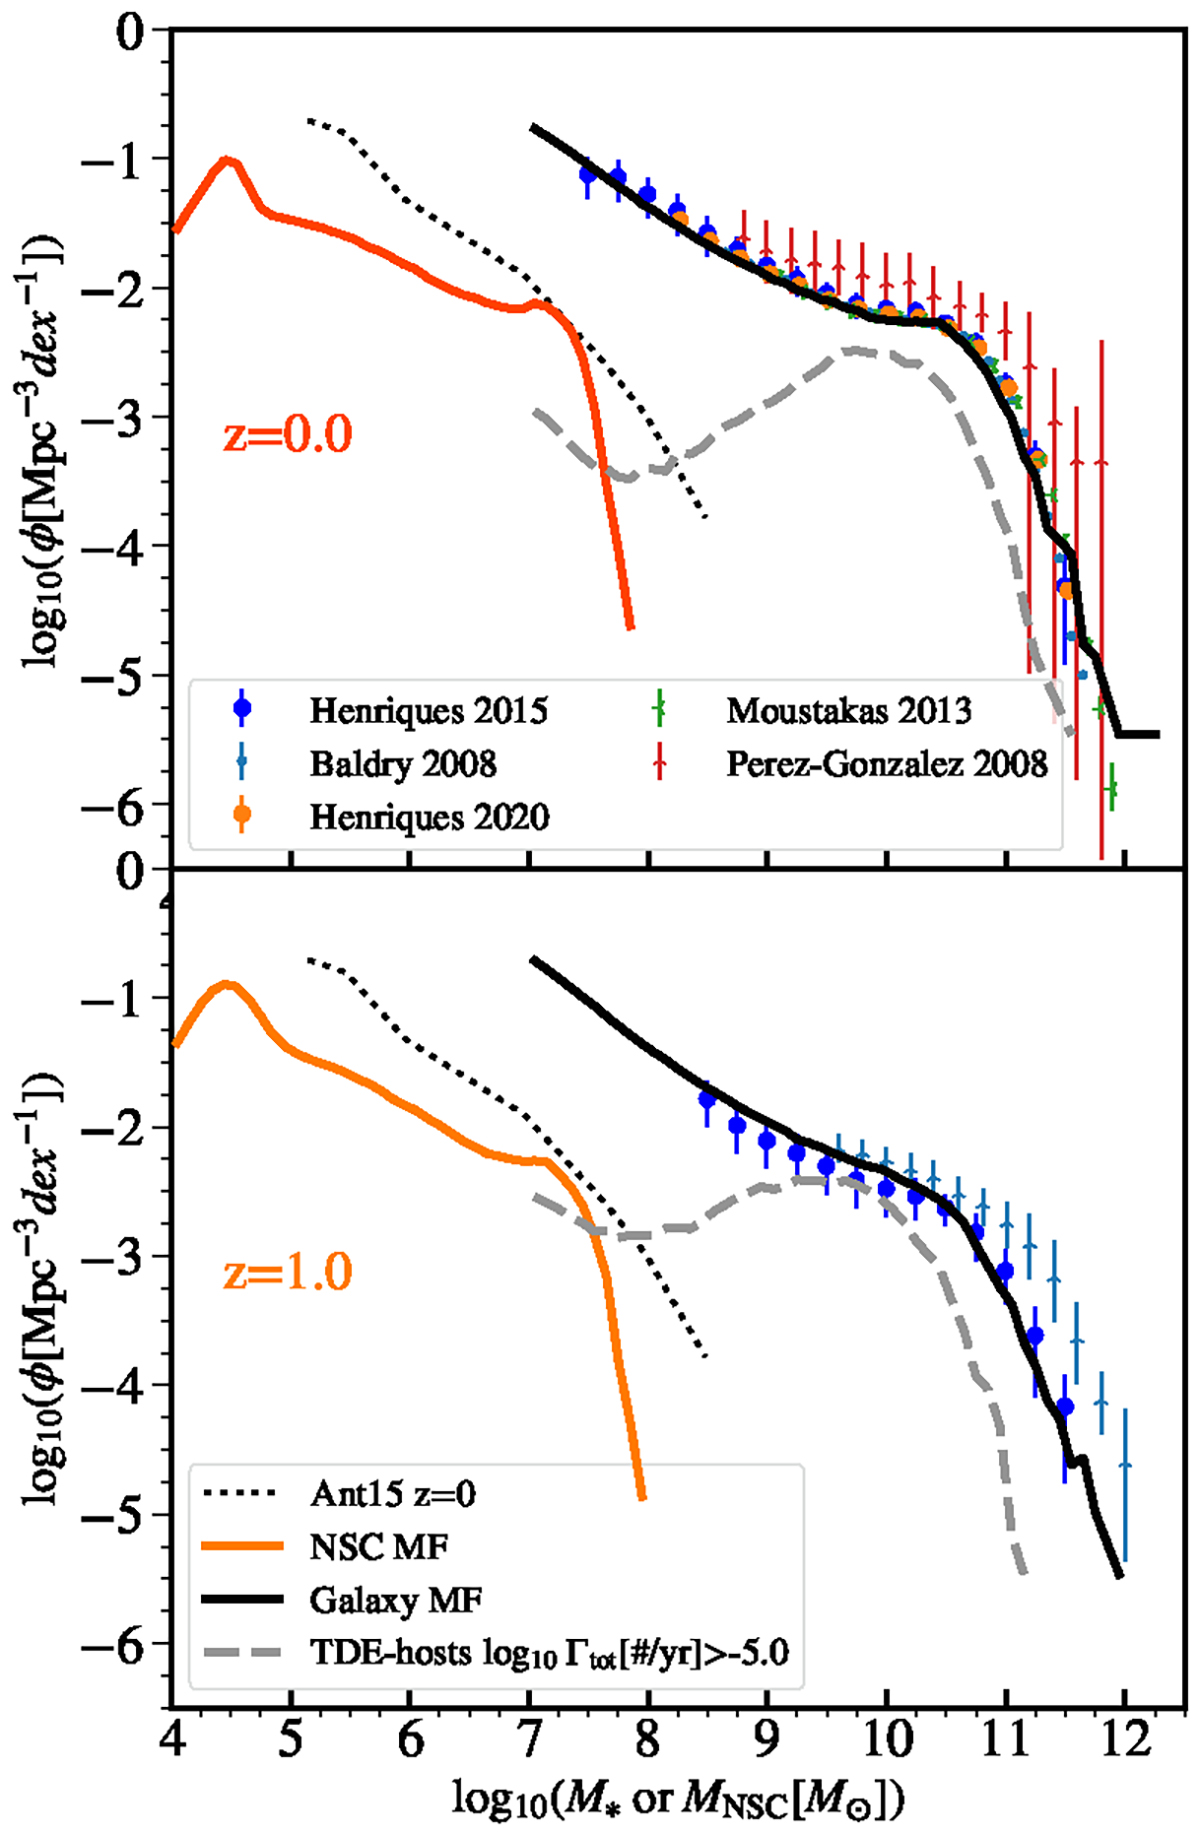
Fig. A.1.
Download original image
Stellar mass functions of all galaxies (solid black) and TDE host galaxies with the highest TDE rates (Γtot > 10−5, gray dashed) for the fiducial model at z = 0 and z = 1. The first is compared with compiled mass constraints from Henriques et al. (2015) and Henriques et al. (2020), Baldry et al. (2008), Pérez-González et al. (2008), and Moustakas et al. (2013) (inset legend). With a thin colored line at lower masses, the NSC Mass Function of the fiducial model is plotted at the same redshifts. For comparison, we display the model NSC mass function from Antonini et al. (2015) at z = 0 (Ant15 z = 0).
Current usage metrics show cumulative count of Article Views (full-text article views including HTML views, PDF and ePub downloads, according to the available data) and Abstracts Views on Vision4Press platform.
Data correspond to usage on the plateform after 2015. The current usage metrics is available 48-96 hours after online publication and is updated daily on week days.
Initial download of the metrics may take a while.