Open Access
Fig. 2
Download original image
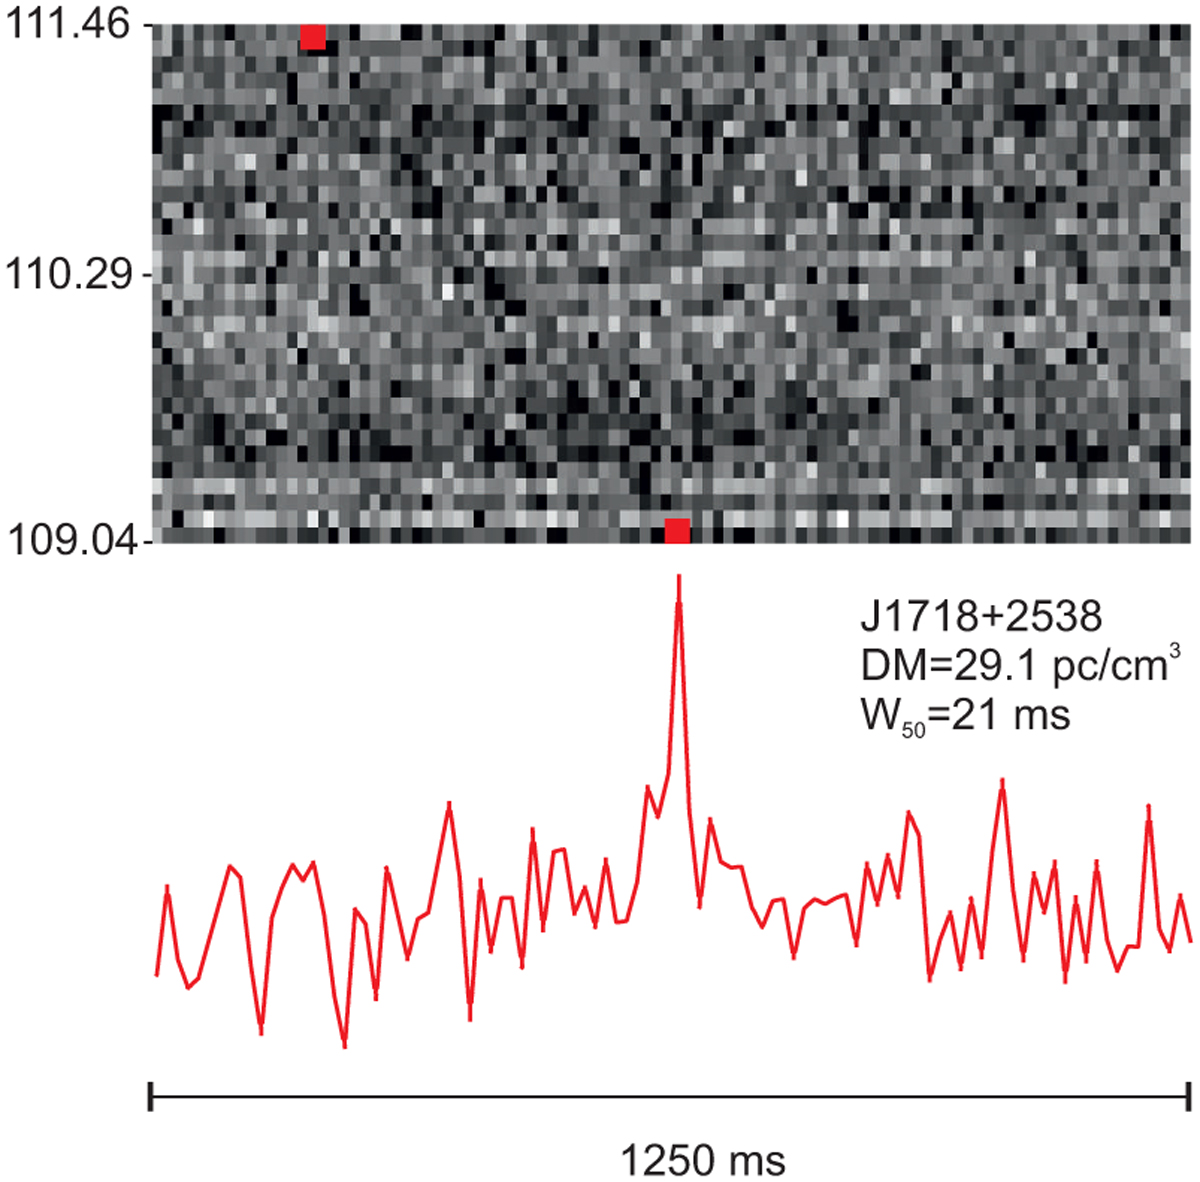
Pulse profile (bottom panel) and dynamic spectrum (upper panel) of J1718+2538. Six pulses were detected in the transient. The two red dots on the dynamic spectrum are the expected beginning and end of the line along which the dispersion delay line should be located.
Current usage metrics show cumulative count of Article Views (full-text article views including HTML views, PDF and ePub downloads, according to the available data) and Abstracts Views on Vision4Press platform.
Data correspond to usage on the plateform after 2015. The current usage metrics is available 48-96 hours after online publication and is updated daily on week days.
Initial download of the metrics may take a while.