Fig. 1
Download original image
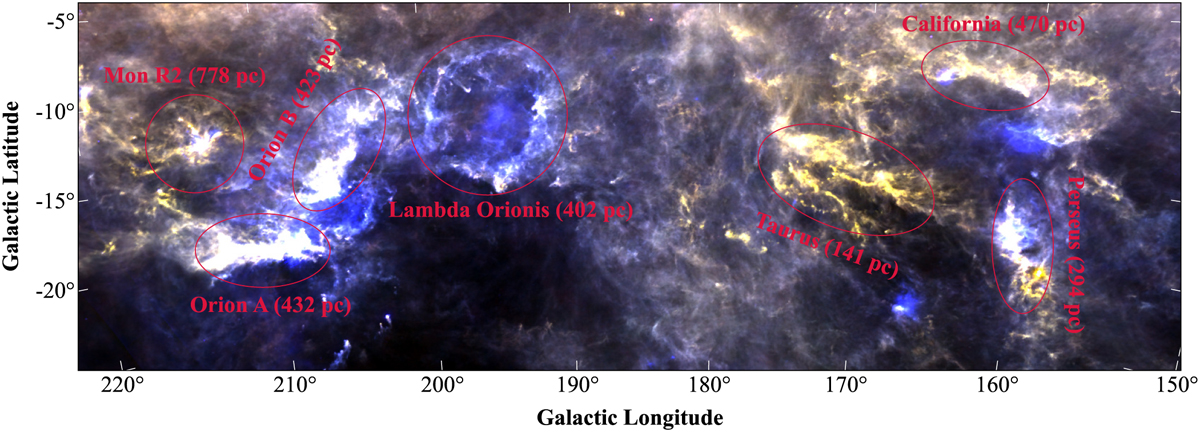
Location of the California GMC with respect to other nearby molecular cloud complexes. The three-color RGB map was created using publicly available data: 850 μm (red) and 350 μm (green) from Planck imaging, and 100 μm (blue) from IRAS (Planck Collaboration XI 2014, Public Data Release 2). The distances of the molecular clouds indicated on the map were inferred from Gaia DR2 parallaxes (Zucker et al. 2019).
Current usage metrics show cumulative count of Article Views (full-text article views including HTML views, PDF and ePub downloads, according to the available data) and Abstracts Views on Vision4Press platform.
Data correspond to usage on the plateform after 2015. The current usage metrics is available 48-96 hours after online publication and is updated daily on week days.
Initial download of the metrics may take a while.