Fig. 10
Download original image
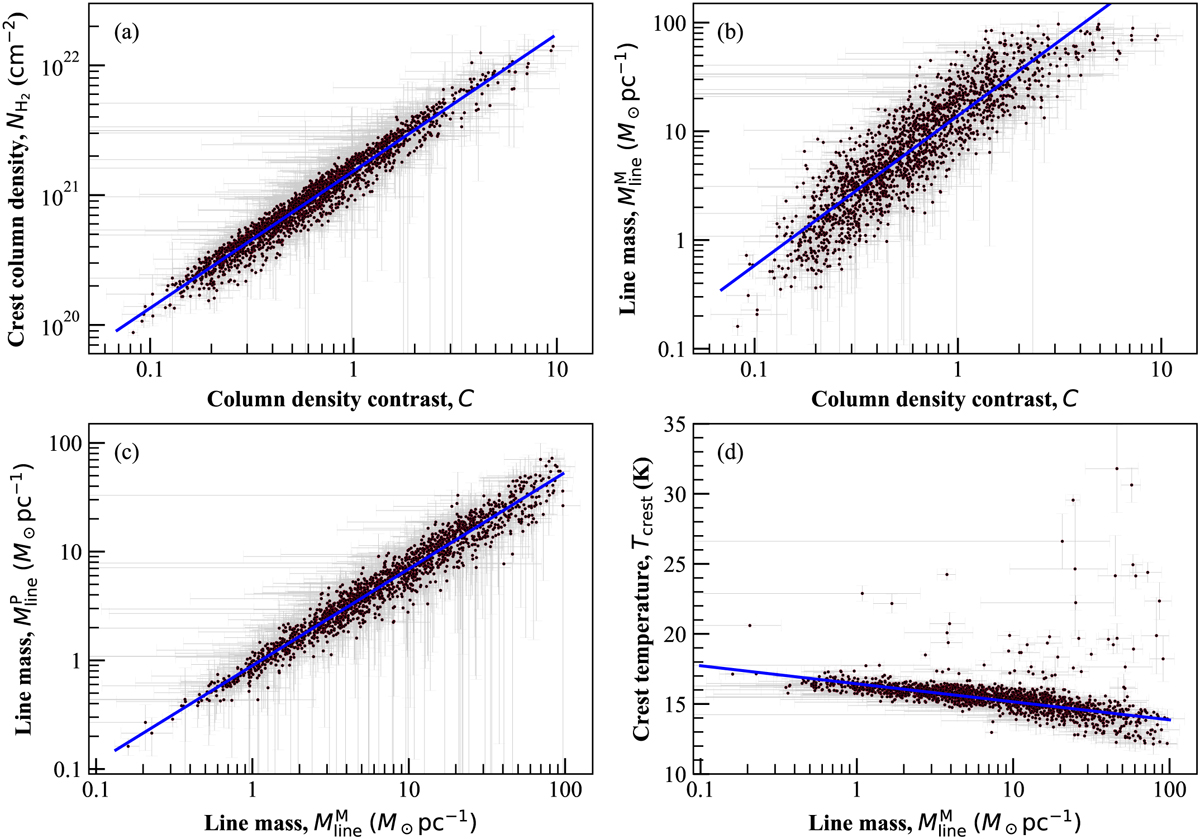
Correlations between filament properties, (a) Filament crest column density against column density contrast. The blue solid line is the fit: ![]() . (b) Filament line mass (
. (b) Filament line mass (![]() ) versus column density contrast, well represented by the fit
) versus column density contrast, well represented by the fit ![]() (blue solid line), (c)
(blue solid line), (c) ![]() estimate against
estimate against ![]() estimate of filament line mass (see text). The blue solid line is the fit:
estimate of filament line mass (see text). The blue solid line is the fit: ![]() . (d) Filament crest temperature versus filament line mass
. (d) Filament crest temperature versus filament line mass ![]() . The blue solid line represents the relation:
. The blue solid line represents the relation: ![]() .
.
Current usage metrics show cumulative count of Article Views (full-text article views including HTML views, PDF and ePub downloads, according to the available data) and Abstracts Views on Vision4Press platform.
Data correspond to usage on the plateform after 2015. The current usage metrics is available 48-96 hours after online publication and is updated daily on week days.
Initial download of the metrics may take a while.