Fig. 12
Download original image
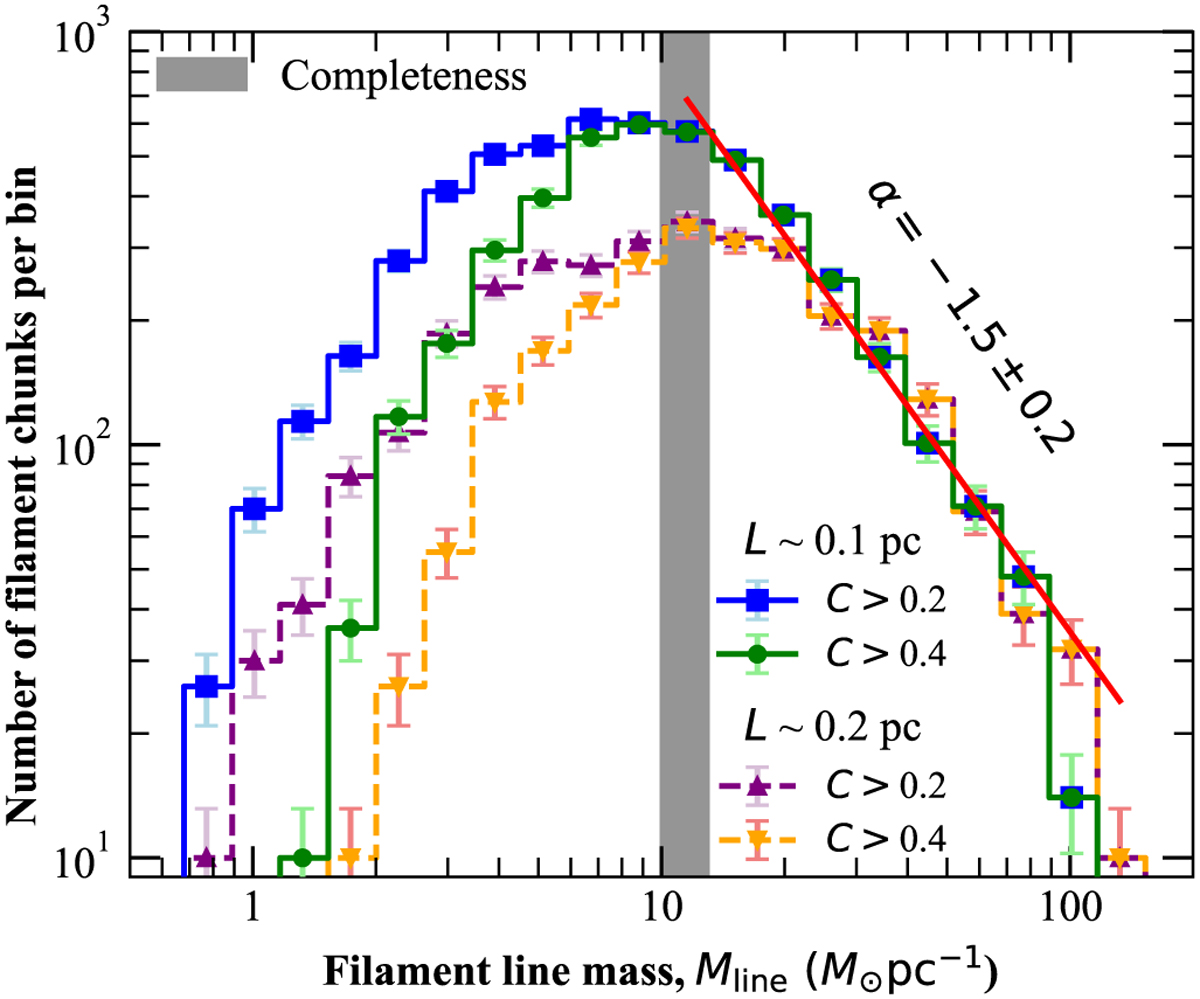
Filament line mass function (FLMF, ΔN/ΔlogMline), derived from the sample of filament chunks in the California GMC. The error bars represent statistical uncertainties (![]() ) in the numbers of filament chunks in each bin. The FLMF based on filament chunks with length L ~ 0.1 pc and contrasts C > 0.2 are shown by the blue histogram; the FLMF of chunks with L ~ 0.1 pc and C > 0.4 by the green histogram. These two FLMFs coincide for Mline > 8 M⊙ pc−1. Above an estimated completeness limit of Mline ≈ 10 M⊙ pc−1 (gray filled area), the filament chunk sample is considered 80% complete (see Appendix B). The FLMF can be fitted by a power law above 10 M⊙ pc−1 with an index of −1.4 ± 0.1 (red solid line). For comparison, the FLMF of filament chunks with L ~ 0.2 pc and C > 0.2 is shown as a purple dashed histogram; the FLMF of chunks with L ~ 0.2 pc and C > 0.4 as an orange dashed histogram.
) in the numbers of filament chunks in each bin. The FLMF based on filament chunks with length L ~ 0.1 pc and contrasts C > 0.2 are shown by the blue histogram; the FLMF of chunks with L ~ 0.1 pc and C > 0.4 by the green histogram. These two FLMFs coincide for Mline > 8 M⊙ pc−1. Above an estimated completeness limit of Mline ≈ 10 M⊙ pc−1 (gray filled area), the filament chunk sample is considered 80% complete (see Appendix B). The FLMF can be fitted by a power law above 10 M⊙ pc−1 with an index of −1.4 ± 0.1 (red solid line). For comparison, the FLMF of filament chunks with L ~ 0.2 pc and C > 0.2 is shown as a purple dashed histogram; the FLMF of chunks with L ~ 0.2 pc and C > 0.4 as an orange dashed histogram.
Current usage metrics show cumulative count of Article Views (full-text article views including HTML views, PDF and ePub downloads, according to the available data) and Abstracts Views on Vision4Press platform.
Data correspond to usage on the plateform after 2015. The current usage metrics is available 48-96 hours after online publication and is updated daily on week days.
Initial download of the metrics may take a while.