Fig. 13
Download original image
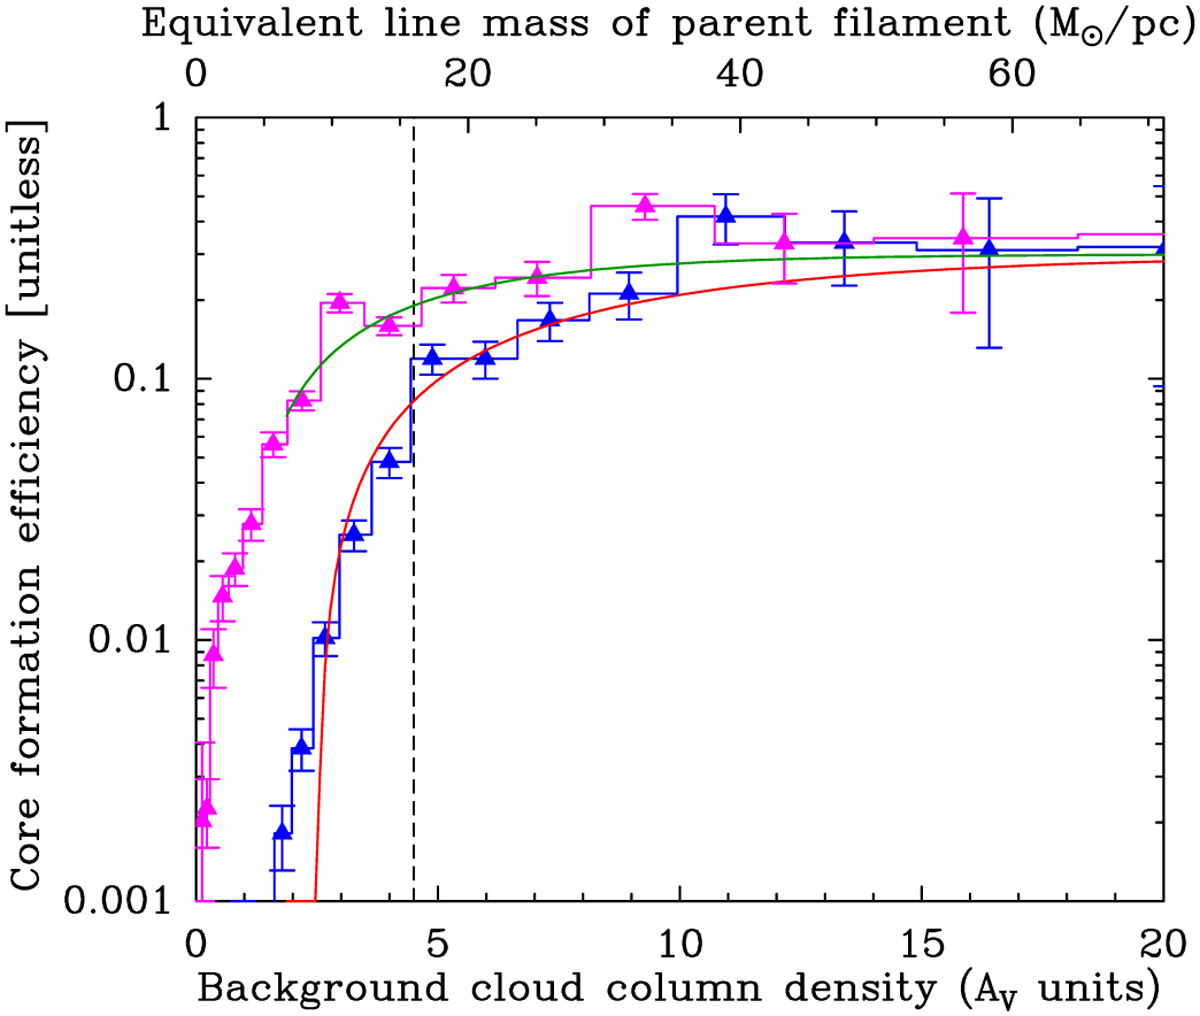
Differential core formation efficiency (CFE) in the California GMC as a function of background cloud column density (blue histogram with error bars) and parent filament column density (magenta histogram), both expressed in AV units. The CFE values were obtained by dividing the mass in the form of candidate prestellar cores in a given column density bin by the cloud mass (blue histogram) or estimated filament mass (magenta histogram) in the same column density bin. The upper x-axis provides a rough estimate of the equivalent filament line mass assuming the parent filament of each core has an effective width 0.18 pc (corresponding to the median observed filament width – see Sect. 3.3.1). The vertical dashed line marks the position of the thermally critical line mass Mline,crit ~ 16 M⊙pc−1, corresponding to AV,bg ~ 4.5. The red and green curves show simple fits to the blue and magenta histograms, respectively, with a smooth step function of the form CFE(AV) = CFEmax[1 − exp(a × AV + b)], with CFEmax ≈ 30%. For the blue distribution, α = −0.16 and b = 0.4; for the magenta distribution, α = −0.28 and b = 0.25.
Current usage metrics show cumulative count of Article Views (full-text article views including HTML views, PDF and ePub downloads, according to the available data) and Abstracts Views on Vision4Press platform.
Data correspond to usage on the plateform after 2015. The current usage metrics is available 48-96 hours after online publication and is updated daily on week days.
Initial download of the metrics may take a while.