Fig. 14
Download original image
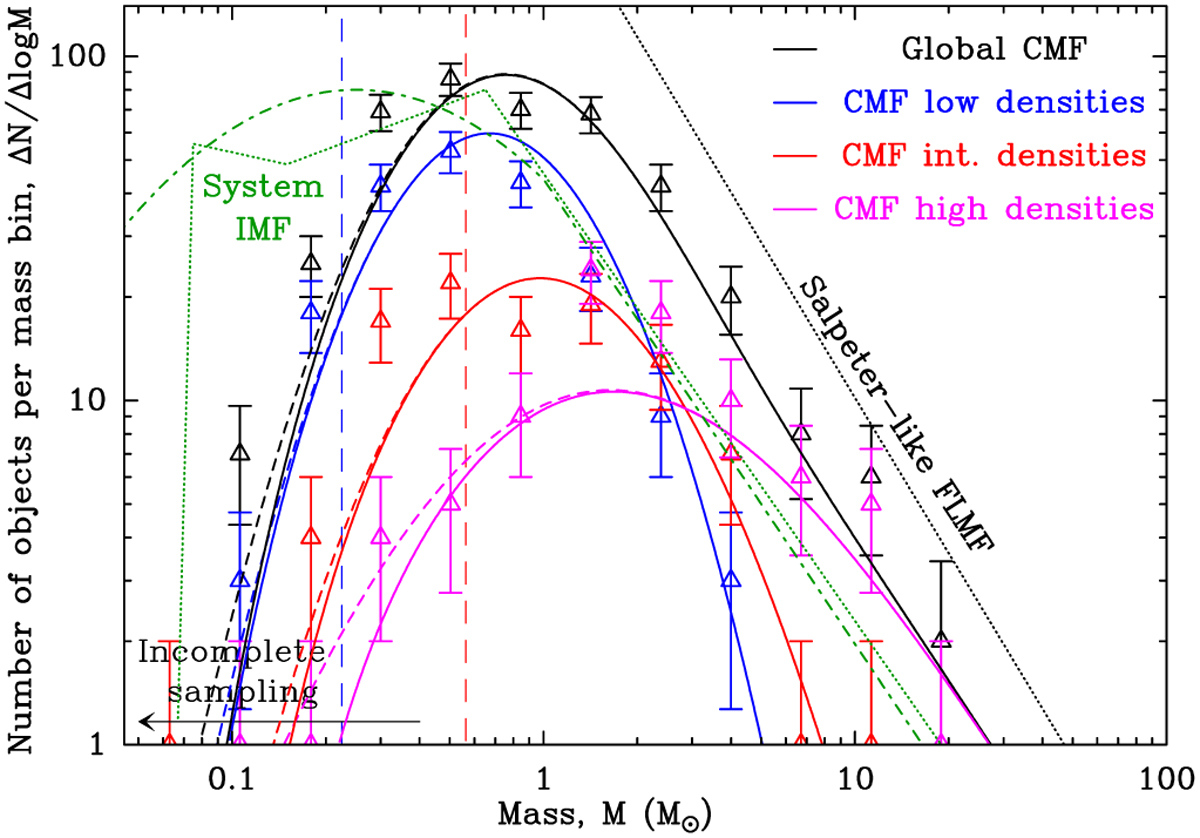
Comparison of the prestellar CMFs (in ΔN/ΔlogM format) expected in the toy model described in André et al. (2019) and in the text (solid and dashed curves) with the observed prestellar CMFs observed in the California GMC (data points and histograms) at low column densities (![]() , in blue), intermediate column densities (
, in blue), intermediate column densities (![]() , in red), high column densities (
, in red), high column densities (![]() , in pink), and overall (all
, in pink), and overall (all ![]() , in black). (The solid curves represent the toy model including the estimated effect of incompleteness, while the dashed curves show the model ignoring the effect of incompleteness.) The black dotted line displays the Salpeter-like power law FLMF,
, in black). (The solid curves represent the toy model including the estimated effect of incompleteness, while the dashed curves show the model ignoring the effect of incompleteness.) The black dotted line displays the Salpeter-like power law FLMF, ![]() , assumed in the toy model and consistent with the observed FLMF in the supercritical regime (see Fig. 12). The green dash-dotted and dotted curves show the system IMFs from Chabrier (2005) and Kroupa et al. (2013), respectively. The two vertical dashed lines mark the estimated 80% completeness limits of the Herschel census of prestellar cores in California at low and high background column densities, respectively. Note how the CMF extends to higher masses at higher column densities, i.e., higher Mline filaments in both the toy model and the observations.
, assumed in the toy model and consistent with the observed FLMF in the supercritical regime (see Fig. 12). The green dash-dotted and dotted curves show the system IMFs from Chabrier (2005) and Kroupa et al. (2013), respectively. The two vertical dashed lines mark the estimated 80% completeness limits of the Herschel census of prestellar cores in California at low and high background column densities, respectively. Note how the CMF extends to higher masses at higher column densities, i.e., higher Mline filaments in both the toy model and the observations.
Current usage metrics show cumulative count of Article Views (full-text article views including HTML views, PDF and ePub downloads, according to the available data) and Abstracts Views on Vision4Press platform.
Data correspond to usage on the plateform after 2015. The current usage metrics is available 48-96 hours after online publication and is updated daily on week days.
Initial download of the metrics may take a while.