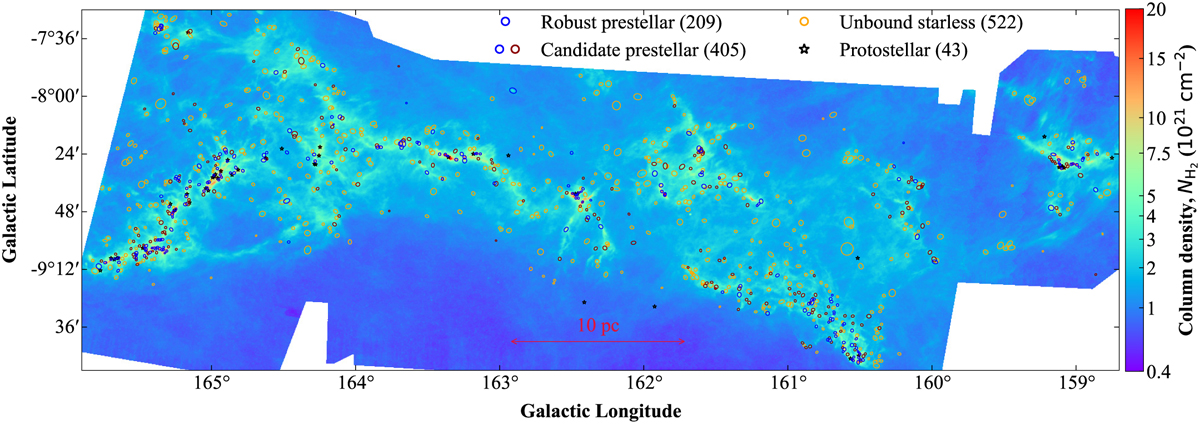
Fig. 2
Download original image
Column density map of the California GMC at an angular resolution of 18.2″, derived from Herschel data with hires (see Sect. 2). The positions of the dense cores identified with getsf (see Sect. 3.2) are overlaid and shown as ellipses of various colors according to core type (blue for robust prestellar cores, blue and brown for candidate prestellar cores, orange for unbound starless cores). For easier visibility, the full axes of the ellipses have twice the actual Gaussian full width at half maximum (FWHM) sizes. Protostellar cores are marked with black pentagrams.
Current usage metrics show cumulative count of Article Views (full-text article views including HTML views, PDF and ePub downloads, according to the available data) and Abstracts Views on Vision4Press platform.
Data correspond to usage on the plateform after 2015. The current usage metrics is available 48-96 hours after online publication and is updated daily on week days.
Initial download of the metrics may take a while.