Fig. 4
Download original image
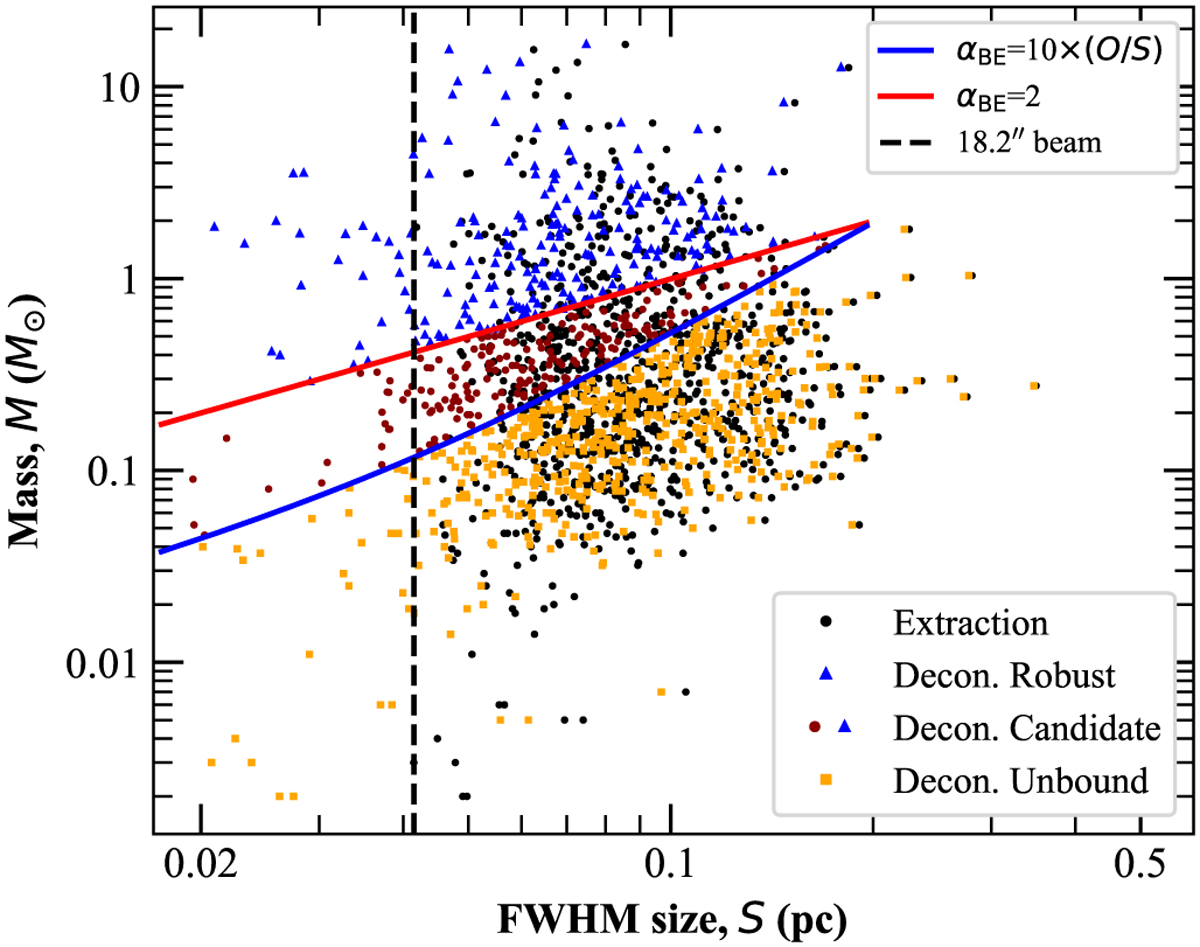
Mass-size diagram for the cores identified in the California molecular cloud. “Extraction” represents the sizes measured directly on the 18.2″ column density map. “Decon. Robust”, “Decon. Candidate”, and “Decon. Unbound” represent the sizes of robust prestellar, candidate prestellar, and unbound starless cores, respectively, after deconvolution. The red solid line represents half of the mass of a thermally critical Bonnor-Ebert sphere (MBE/2) of radius R at a temperature of 10 K. The blue solid line marks the estimated threshold for selecting candidate prestellar cores. The dashed vertical line marks the 18.2″ beam size.
Current usage metrics show cumulative count of Article Views (full-text article views including HTML views, PDF and ePub downloads, according to the available data) and Abstracts Views on Vision4Press platform.
Data correspond to usage on the plateform after 2015. The current usage metrics is available 48-96 hours after online publication and is updated daily on week days.
Initial download of the metrics may take a while.