Fig. 8
Download original image
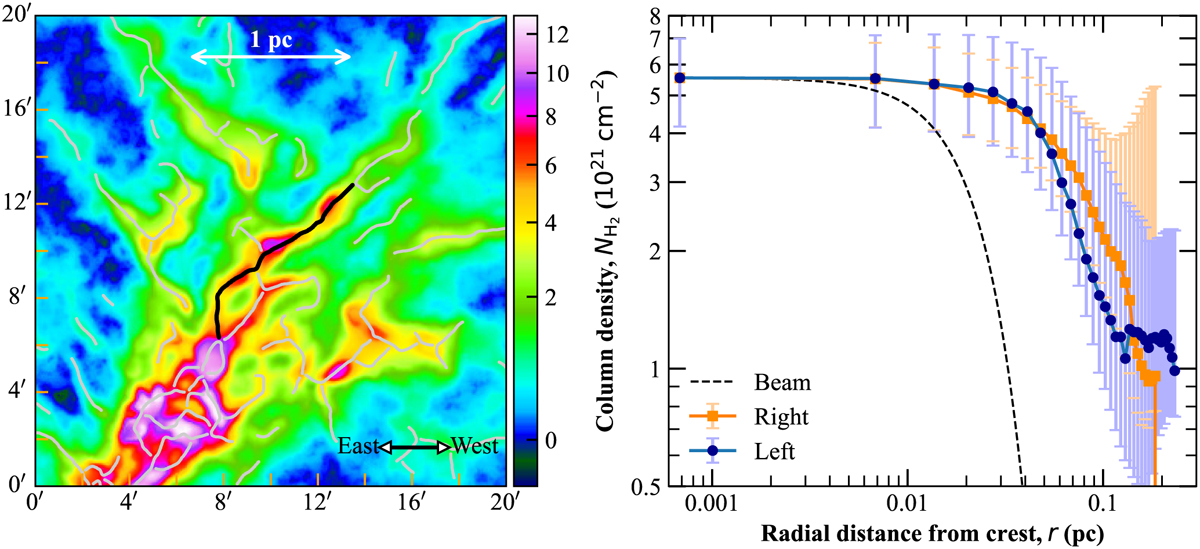
Close-up view of the filament network (left) and example of a filament radial profile (right). Left: skeletons of several filaments depicted as grey solid curves and traced within a 20′ × 20′ subfield of the column density image at 18.2″ resolution. The black curve represents the skeleton of the filament whose radial profile is displayed in the right panel. Right: median one-sided column density profiles measured on both the left (purple solid line) and right (blue) sides of the filament, with the black dashed curve representing the beam profile. The median half maximum width measured on the left (north-east) side is 0.13 pc, that on the right (south-west) side is 0.17 pc, and the mean is 0.15 pc.
Current usage metrics show cumulative count of Article Views (full-text article views including HTML views, PDF and ePub downloads, according to the available data) and Abstracts Views on Vision4Press platform.
Data correspond to usage on the plateform after 2015. The current usage metrics is available 48-96 hours after online publication and is updated daily on week days.
Initial download of the metrics may take a while.