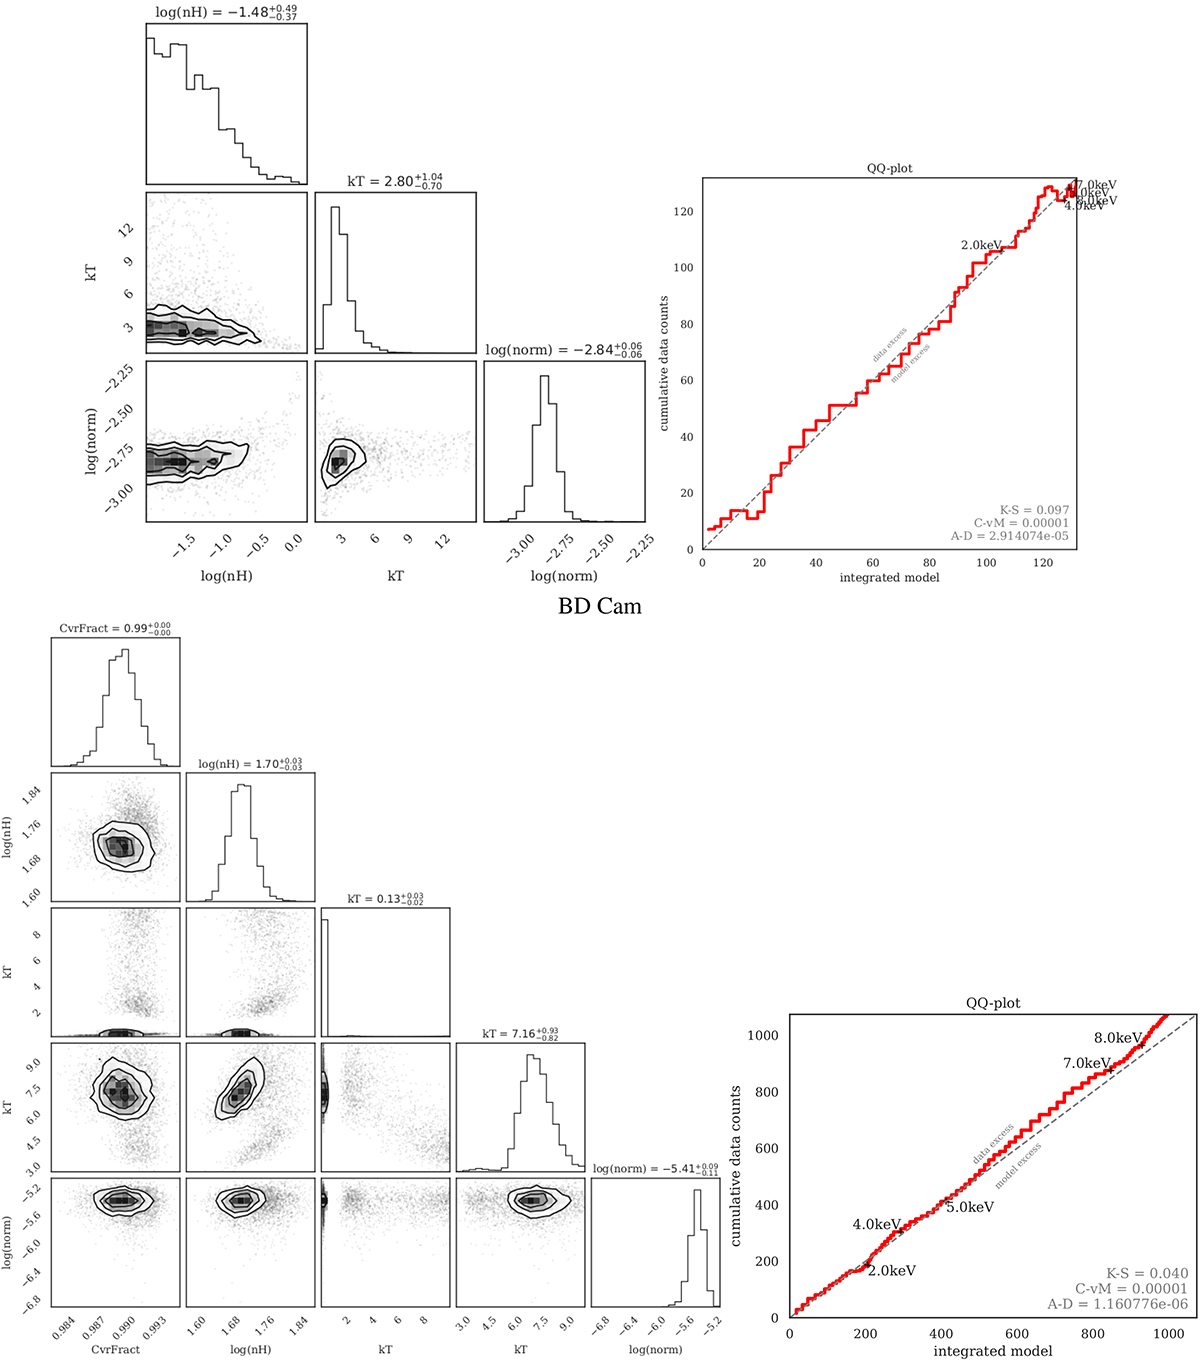
Fig. B.1.
Download original image
Corner plots of the fitted parameters obtained from the Bayesian X-ray (BXA) algorithm. The probability densities are shown with the shaded contoured region and its histogram indicating the average and error values for each parameter. QQ (quantile–quantile) plots are also shown for each convergent result. Some statistical tests are also calculated: Kolmogorov-Smirnov (K − S), Cramérvon Mises (C − vM), and the AndersonDarling (A − D).
Current usage metrics show cumulative count of Article Views (full-text article views including HTML views, PDF and ePub downloads, according to the available data) and Abstracts Views on Vision4Press platform.
Data correspond to usage on the plateform after 2015. The current usage metrics is available 48-96 hours after online publication and is updated daily on week days.
Initial download of the metrics may take a while.