Fig. 2
Download original image
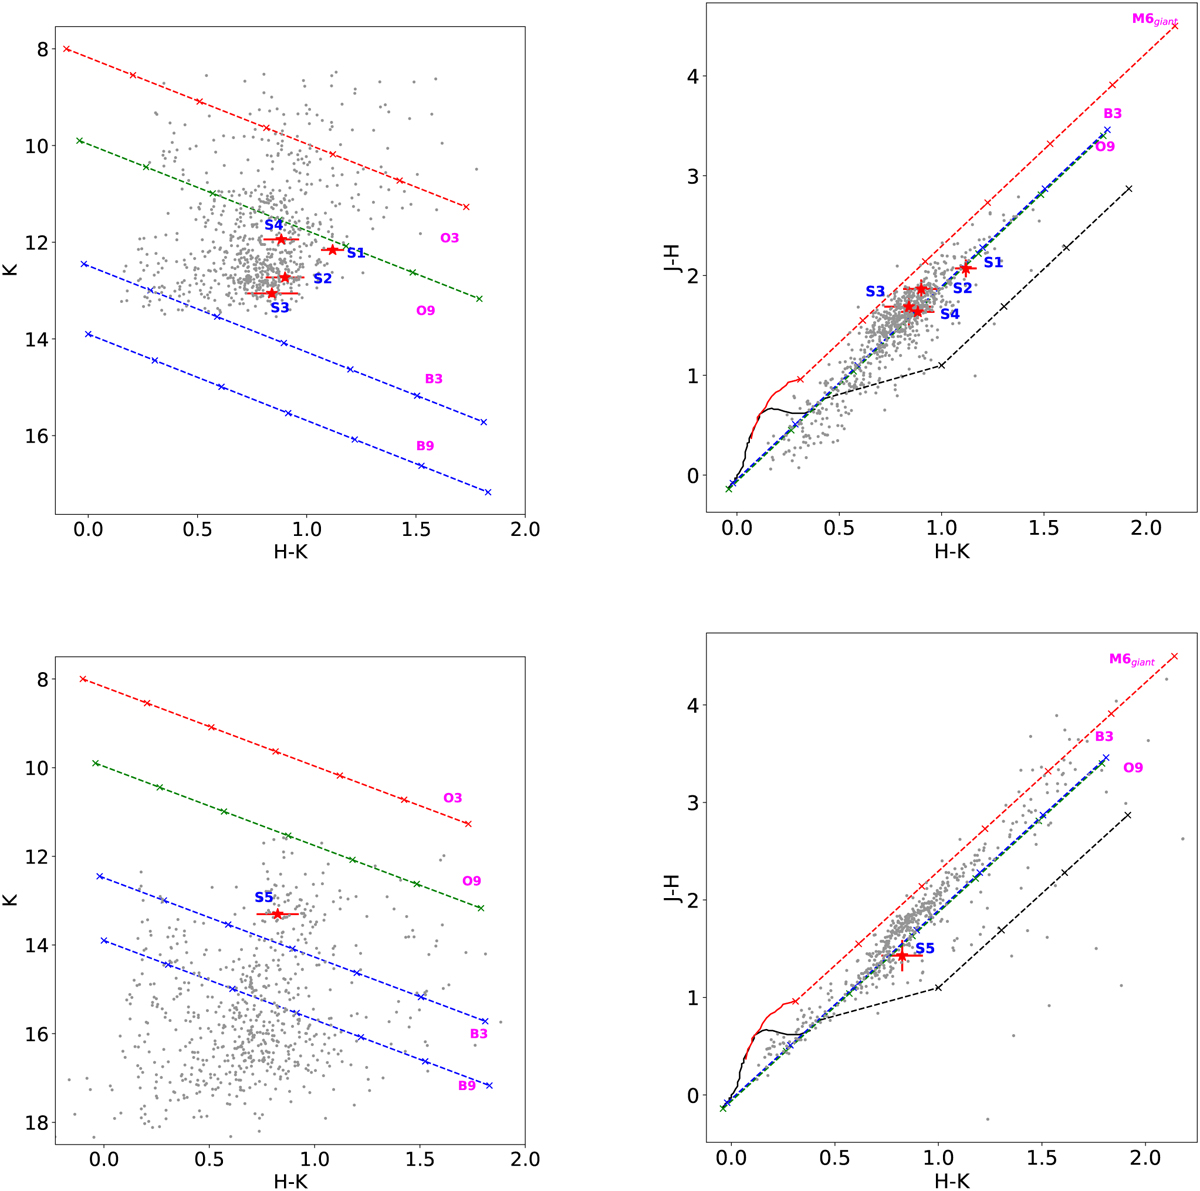
Images showing the color-magnitude and color-color diagrams of the 2MASS and UKIDSS point sources. Top left: K vs. H − K color-magnitude diagram of the 2MASS near-infrared point sources within a circle of radius 4′ centered at G19.68-0.13. The reddening vectors of the massive stars (O3-B9) are plotted on the color-magnitude diagram. Top right: J − H vs. H − K color-color diagram of the 2MASS point sources with spectral type earlier than B9 in the color-magnitude diagram. The solid black and red lines represent the loci of Class V (main sequence stars) and Class III (giant stars) objects respectively (Bessell & Brett 1988; Cox 2000). The black long-dashed line represents the locus of the T-Tauri stars (Meyer et al. 1997). The reddening vectors corresponding to the different classes are also shown using dotted lines with crosses placed at an increasing interval of AV = 5. The candidate ionizing stars are shown using red ‘*’ with respective error bars. Bottom row: same as the top row but for the point sources detected in the UKIDSS survey.
Current usage metrics show cumulative count of Article Views (full-text article views including HTML views, PDF and ePub downloads, according to the available data) and Abstracts Views on Vision4Press platform.
Data correspond to usage on the plateform after 2015. The current usage metrics is available 48-96 hours after online publication and is updated daily on week days.
Initial download of the metrics may take a while.