Fig. 4
Download original image
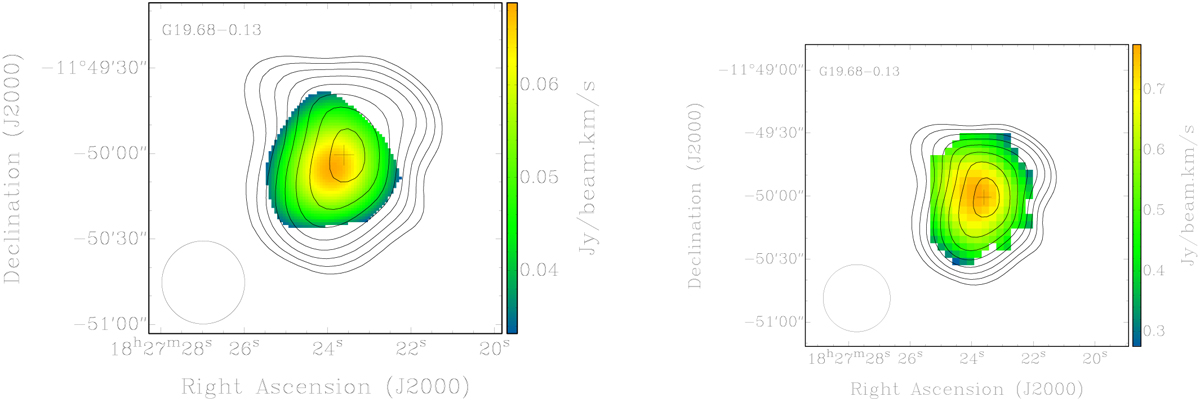
Images showing the moment-0 maps of G19.68−0.13 overlaid with the radio contours from the GLOSTAR-D continuum maps in black. Left: uGMRT, right: GLOSTAR-D. The contour levels are similar to those in Fig. 3. The location of G19.68−0.13 reported in the THOR radio continuum catalog is shown using a black ‘+’ sign. The respective beam sizes are shown at the bottom-left corners of the figures.
Current usage metrics show cumulative count of Article Views (full-text article views including HTML views, PDF and ePub downloads, according to the available data) and Abstracts Views on Vision4Press platform.
Data correspond to usage on the plateform after 2015. The current usage metrics is available 48-96 hours after online publication and is updated daily on week days.
Initial download of the metrics may take a while.