Fig. 1
Download original image
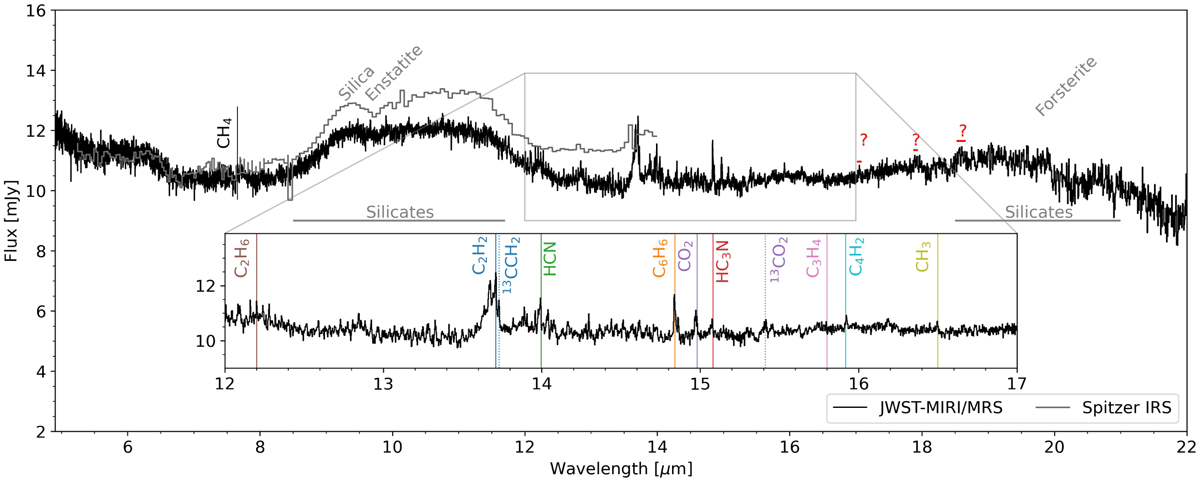
JWST-MIRI/MRS spectrum of Sz28. The detected molecular species and the dust features are labelled. The spectrum from Spitzer is depicted in grey. The red question mark (?) indicates the unidentified spectral features and the red horizontal lines show their wavelength range. The Q branches of the molecules are shown as solid lines along with their identified isotopologues, if any, as dotted lines.
Current usage metrics show cumulative count of Article Views (full-text article views including HTML views, PDF and ePub downloads, according to the available data) and Abstracts Views on Vision4Press platform.
Data correspond to usage on the plateform after 2015. The current usage metrics is available 48-96 hours after online publication and is updated daily on week days.
Initial download of the metrics may take a while.