Open Access
Fig. A.2
Download original image
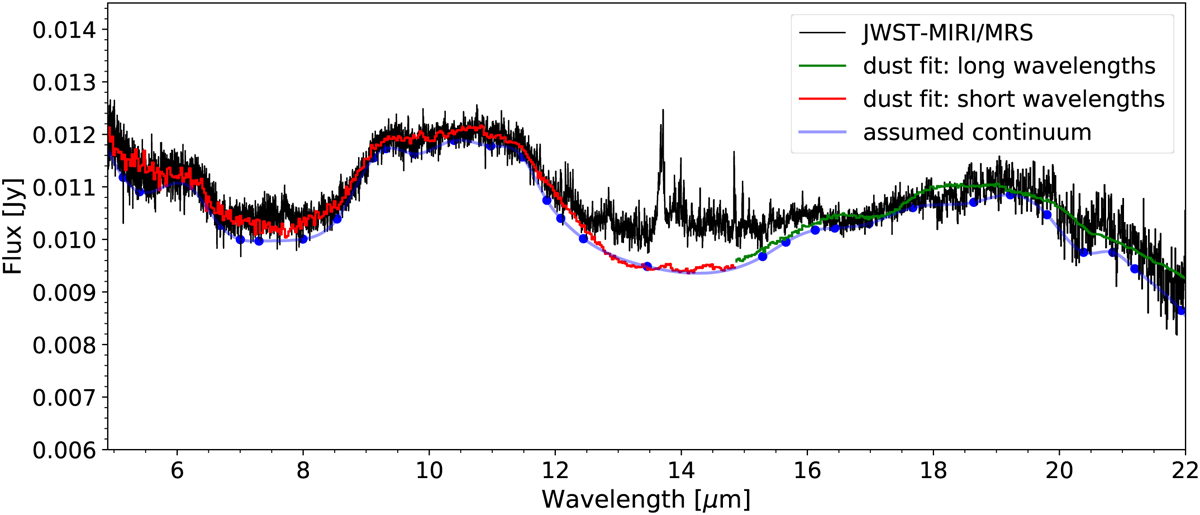
Interpolated dust continuum assumed (blue) together with the JWST-MIRI/MRS spectrum of Sz28 (black). The blue dots mark the locations used for interpolation. The continua provided by the dust fits for the short and long wavelength part of the spectrum are shown in red and green, respectively.
Current usage metrics show cumulative count of Article Views (full-text article views including HTML views, PDF and ePub downloads, according to the available data) and Abstracts Views on Vision4Press platform.
Data correspond to usage on the plateform after 2015. The current usage metrics is available 48-96 hours after online publication and is updated daily on week days.
Initial download of the metrics may take a while.