Fig. D.1
Download original image
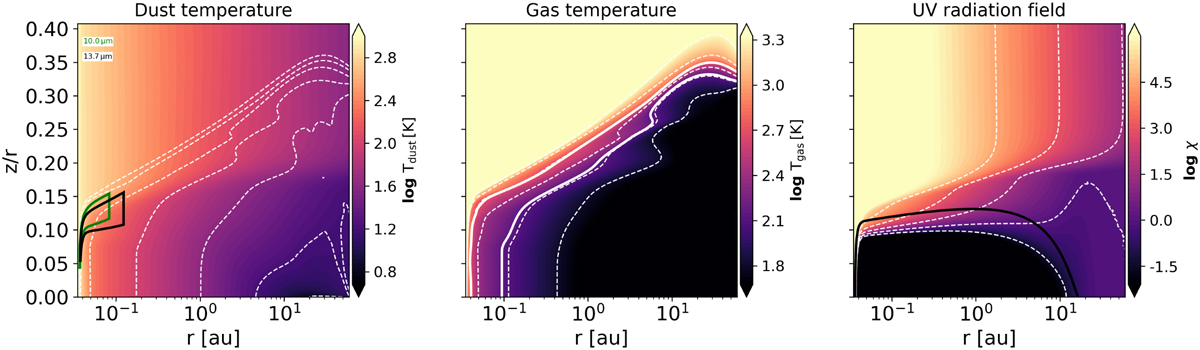
Dust temperature, gas temperature, and UV radiation field calculated from radiative transfer for the canonical and enhanced C/O models. The green and black contours show the dust continuum at 10 and 13.7 μm in first panel. The white contours in the second panel show the gas temperature corresponding to 140 K and 475 K. The black contour shows the Aυ=1 mag in the last panel. The dotted white contours represent the values corresponding to the tick marks of the color scale.
Current usage metrics show cumulative count of Article Views (full-text article views including HTML views, PDF and ePub downloads, according to the available data) and Abstracts Views on Vision4Press platform.
Data correspond to usage on the plateform after 2015. The current usage metrics is available 48-96 hours after online publication and is updated daily on week days.
Initial download of the metrics may take a while.