Fig. 9
Download original image
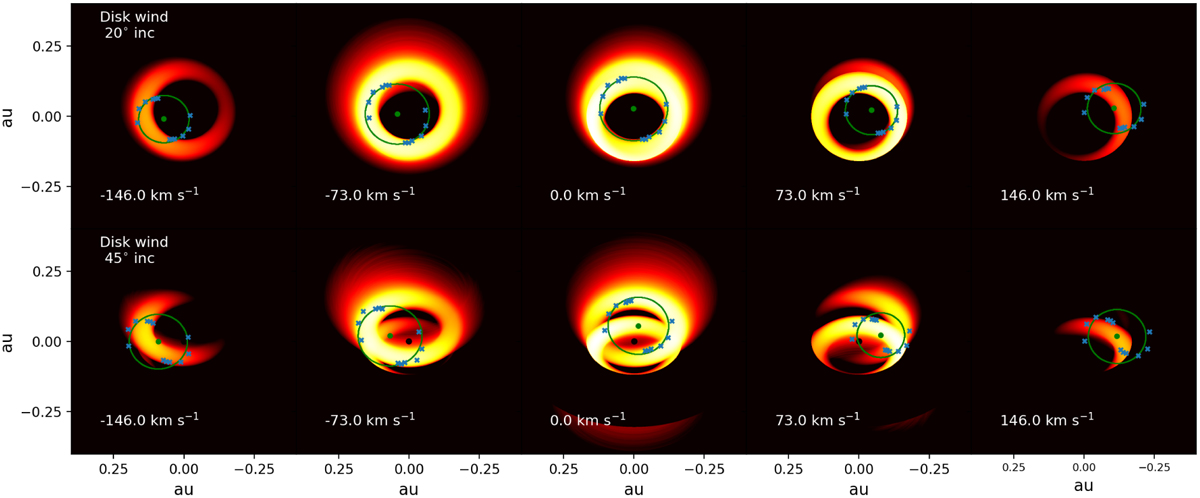
Images of the disk wind model DW I at different velocities across the Brγ line and at 20° (top row) and 45°(bottom row) inclination. The green ellipses depict the HWHM of the Gaussian disk model used to derive the characteristic sizes of the emission region. The Gaussian model is fixed at 20° inclination in both cases to remain consistent with the treatment of the original GRAVITY data. It is centred on the photocentre of each image, as recovered from the differential phases. The blue points signify the HWHMs obtained for the individual six baselines of the GRAVITY UT configuration that was used to observe RU Lup in 2021.
Current usage metrics show cumulative count of Article Views (full-text article views including HTML views, PDF and ePub downloads, according to the available data) and Abstracts Views on Vision4Press platform.
Data correspond to usage on the plateform after 2015. The current usage metrics is available 48-96 hours after online publication and is updated daily on week days.
Initial download of the metrics may take a while.