Fig. C.1.
Download original image
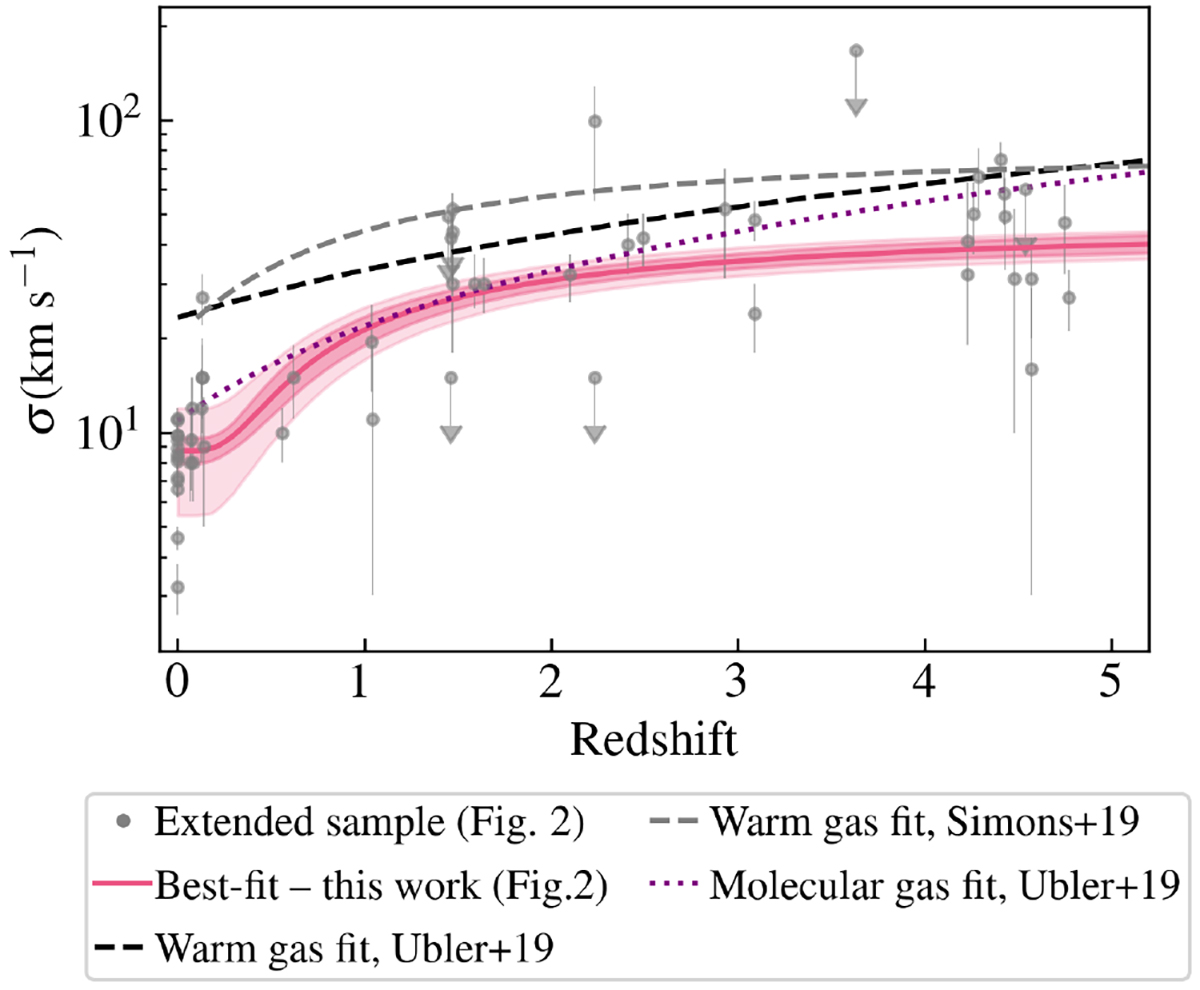
Comparison between cold gas dynamics and previous results from the literature. The gray points and pink lines show the extended sample and the best-fit relations presented in Fig. 2. The black and gray dashed lines show the best-fit relations found by Übler et al. (2019) and Simons et al. (2017) using samples of main-sequence galaxies with stellar masses within a range larger (log(M⋆/M⊙) = 9 − 11.5) than the ones probed by the extended sample. The relations derived by Übler et al. (2019) and Simons et al. (2017) are obtained by fitting data points in the redshift range [0, 3.8] and [0.1-2.5], respectively. The dashed curves show the extrapolations of these relations up to z = 5. Similarly, the purple dotted line shows the best-fit relation obtained by fitting molecular gas data for 9 main-sequence galaxies at z = 0.7 − 2.4 (Übler et al. 2019) and its extrapolation up to z = 5.
Current usage metrics show cumulative count of Article Views (full-text article views including HTML views, PDF and ePub downloads, according to the available data) and Abstracts Views on Vision4Press platform.
Data correspond to usage on the plateform after 2015. The current usage metrics is available 48-96 hours after online publication and is updated daily on week days.
Initial download of the metrics may take a while.