Fig. 2.
Download original image
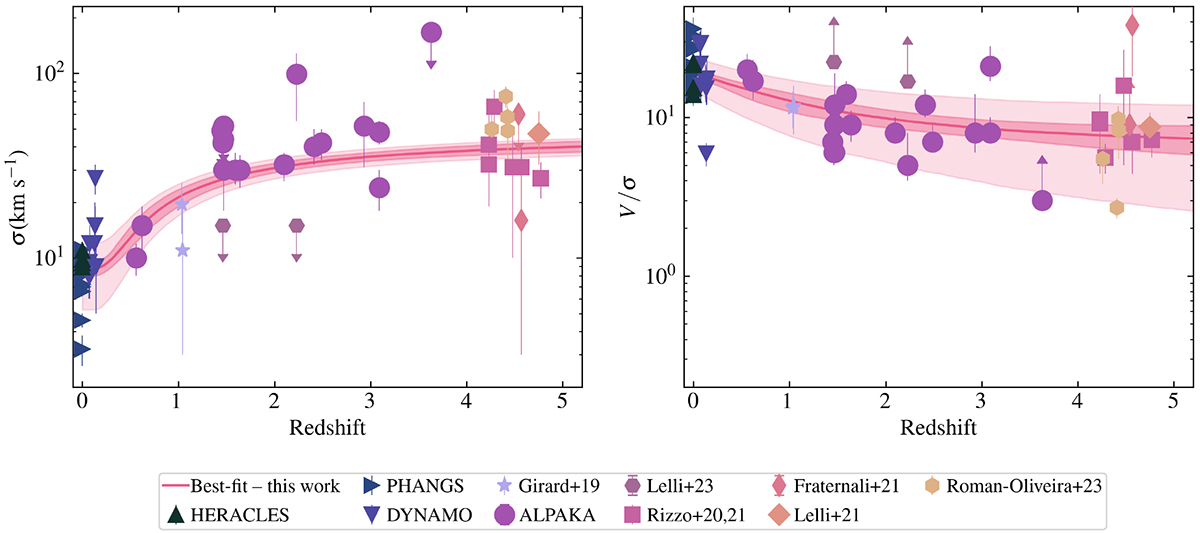
Redshift distribution of velocity dispersion (σ, left panel) and rotational support (V/σ, right panel) for our extended sample (colored markers) consisting of massive galaxies. The σ and V/σ values are derived using emission lines tracing cold gas (i.e., CO, [CI], [CII]). The pink solid lines show the best-fit empirical relations, with the 1-σ uncertainties (dark pink area) and the intrinsic scatter (pink area).
Current usage metrics show cumulative count of Article Views (full-text article views including HTML views, PDF and ePub downloads, according to the available data) and Abstracts Views on Vision4Press platform.
Data correspond to usage on the plateform after 2015. The current usage metrics is available 48-96 hours after online publication and is updated daily on week days.
Initial download of the metrics may take a while.