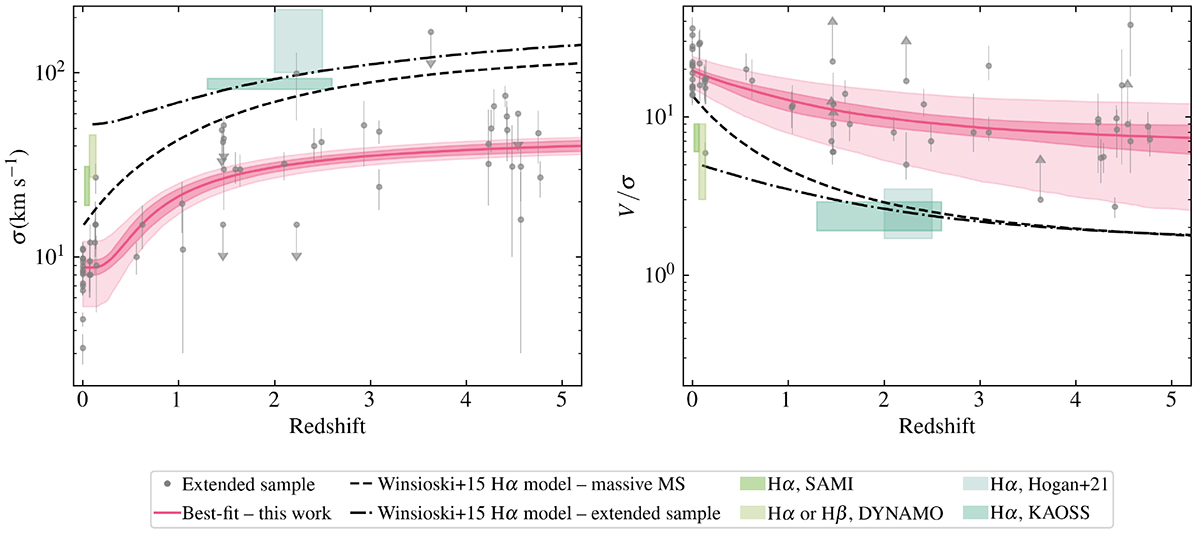
Fig. 3.
Download original image
Comparison between cold and warm gas dynamical evolution. The gray points and pink lines show our extended sample and the best-fit relations presented in Fig. 2. The two green boxes indicate the redshift coverages and the 16th and 84th percentiles for samples with galaxy dynamics derived from Hα (Varidel et al. 2020; Girard et al. 2021; Hogan et al. 2021; Birkin et al. 2023). The dashed and dash-dotted black lines show the expected relations for samples of main-sequence massive galaxies and for the galaxies in our extended sample, respectively. These relations are derived using the disk-instability model proposed by Wisnioski et al. (2015), which is used to reproduce the redshift evolution of σ and V/σ derived from warm gas tracers (see Sect. 3.2).
Current usage metrics show cumulative count of Article Views (full-text article views including HTML views, PDF and ePub downloads, according to the available data) and Abstracts Views on Vision4Press platform.
Data correspond to usage on the plateform after 2015. The current usage metrics is available 48-96 hours after online publication and is updated daily on week days.
Initial download of the metrics may take a while.