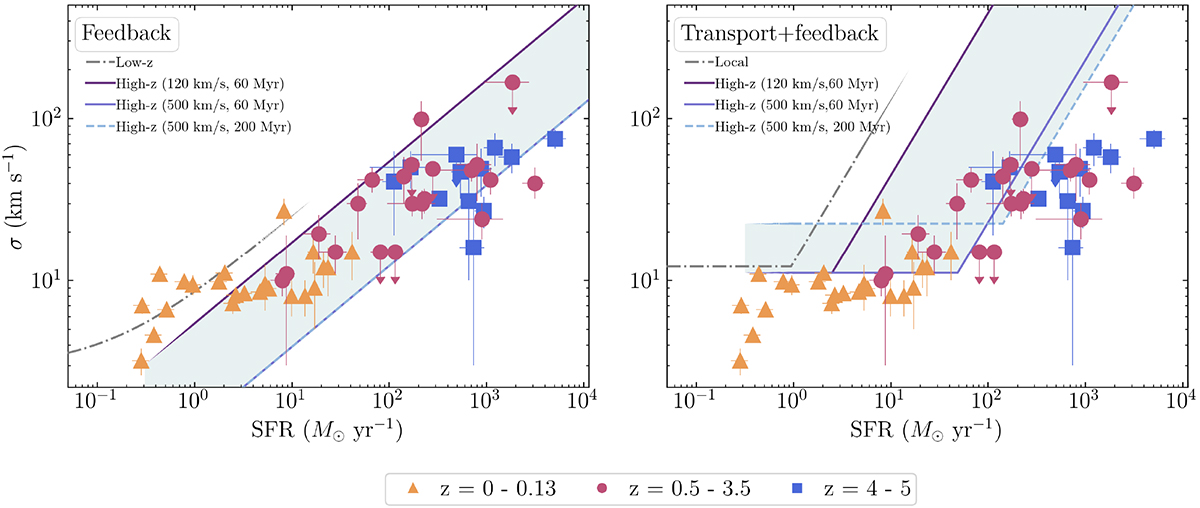
Fig. 4.
Download original image
Distribution of σ vs. SFR for our extended sample divided in three redshift bins, as indicated in the legend, compared with the feedback model (left panel) and the trasport+feedback model (right panel) from K18. The gray dashed and colored solid lines are obtained using the prescriptions for low and high-z galaxies, as reported in K18. For the high-z models, we vary the rotation velocity and orbital times (parenthesis in the legend) in the range covered by the extended sample (shaded area). In the left panel, the solid dark blue and dashed light blue lines overlap.
Current usage metrics show cumulative count of Article Views (full-text article views including HTML views, PDF and ePub downloads, according to the available data) and Abstracts Views on Vision4Press platform.
Data correspond to usage on the plateform after 2015. The current usage metrics is available 48-96 hours after online publication and is updated daily on week days.
Initial download of the metrics may take a while.