Open Access
Fig. 6.
Download original image
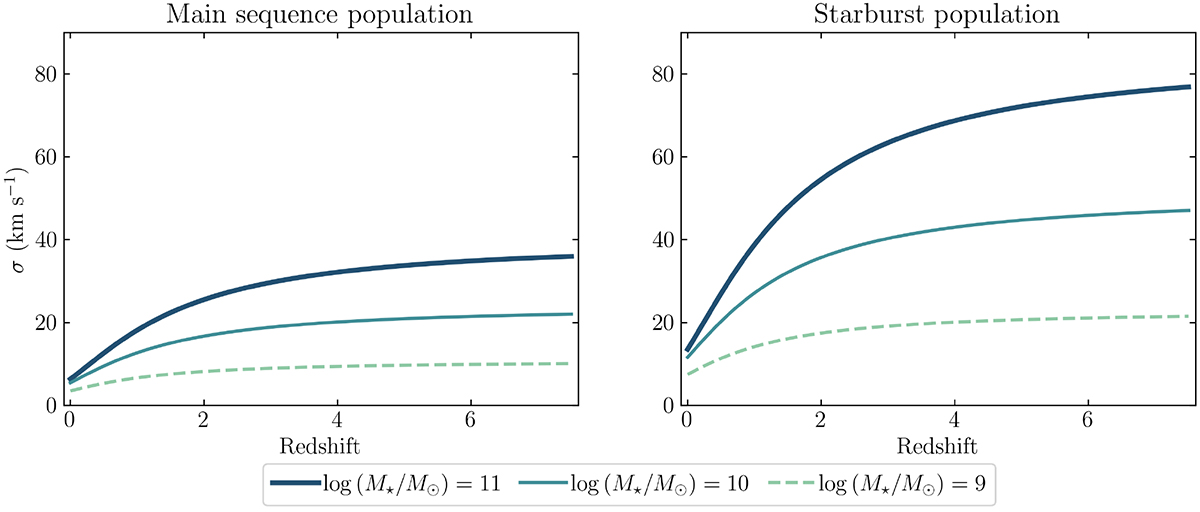
Predicted evolution of σ as a function of redshift for populations of main-sequence (ΔMS = 1, left panel) and starburst (ΔMS = 10, right panel) galaxies. Different lines show the evolution at different stellar masses, as indicated in the legend.
Current usage metrics show cumulative count of Article Views (full-text article views including HTML views, PDF and ePub downloads, according to the available data) and Abstracts Views on Vision4Press platform.
Data correspond to usage on the plateform after 2015. The current usage metrics is available 48-96 hours after online publication and is updated daily on week days.
Initial download of the metrics may take a while.