Fig. 1.
Download original image
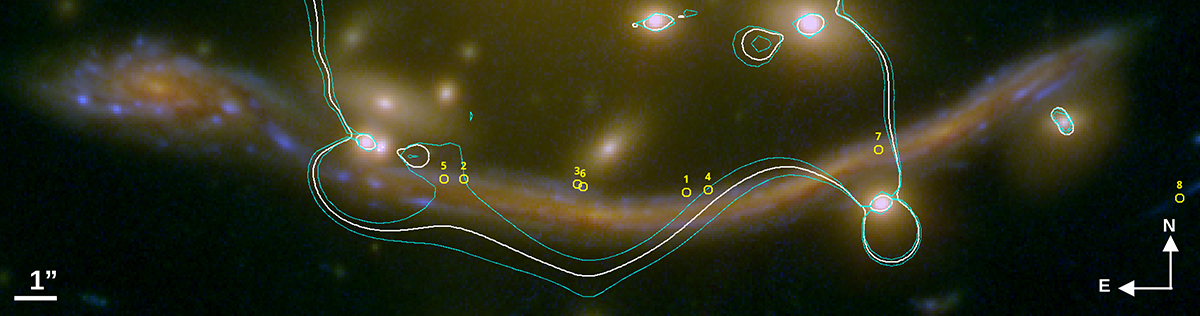
Dragon arc as seen by HST (blue = F435W, green = F814W, red = F160W). The eight transients (seven in the arc) identified by Kelly et al. (2022) are marked with circles. Labels are the same as in the original reference. The white curve is the CC from our lens model (see Appendix) at the redshift of the arc. The two cyan curves mark the boundary region between macromodel magnification above and below 100. The arc covers ∼1150 kpc2 in the lens plane. Out of this, 190 kpc2 is within the cyan curves (near region) and 960 kpc2 is outside the cyan lines (far region).
Current usage metrics show cumulative count of Article Views (full-text article views including HTML views, PDF and ePub downloads, according to the available data) and Abstracts Views on Vision4Press platform.
Data correspond to usage on the plateform after 2015. The current usage metrics is available 48-96 hours after online publication and is updated daily on week days.
Initial download of the metrics may take a while.