Open Access
Fig. 10.
Download original image
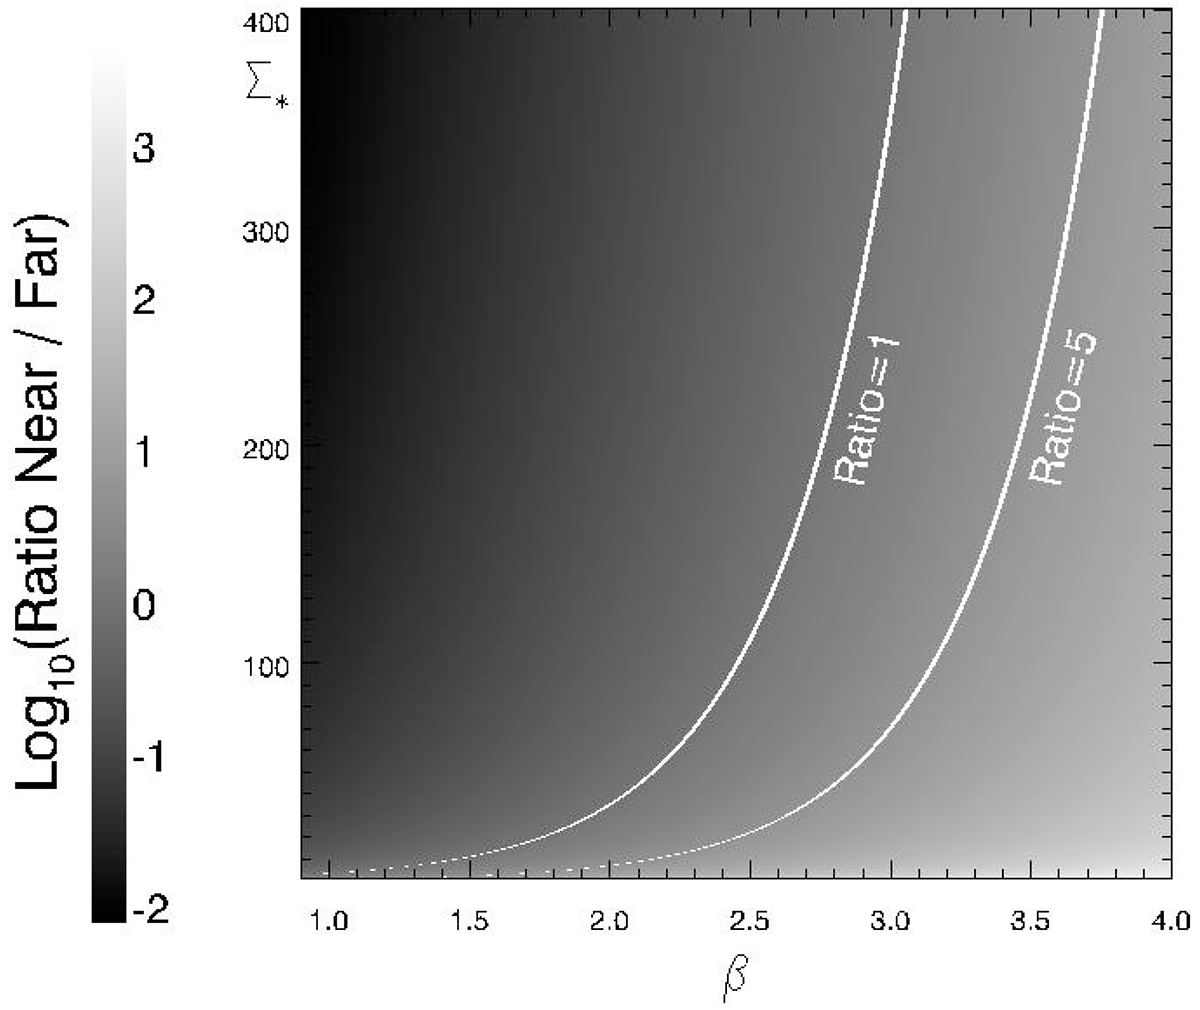
Ratio Nnear/Nfar as a function of β and Σ* (expressed in units of M⊙ pc−2). The white lines show the combination of β and Σ* that predict the same number of events in the far and near regions (Ratio = 1) or five time more events in the near region than in the far region (Ratio = 5).
Current usage metrics show cumulative count of Article Views (full-text article views including HTML views, PDF and ePub downloads, according to the available data) and Abstracts Views on Vision4Press platform.
Data correspond to usage on the plateform after 2015. The current usage metrics is available 48-96 hours after online publication and is updated daily on week days.
Initial download of the metrics may take a while.