Fig. 11.
Download original image
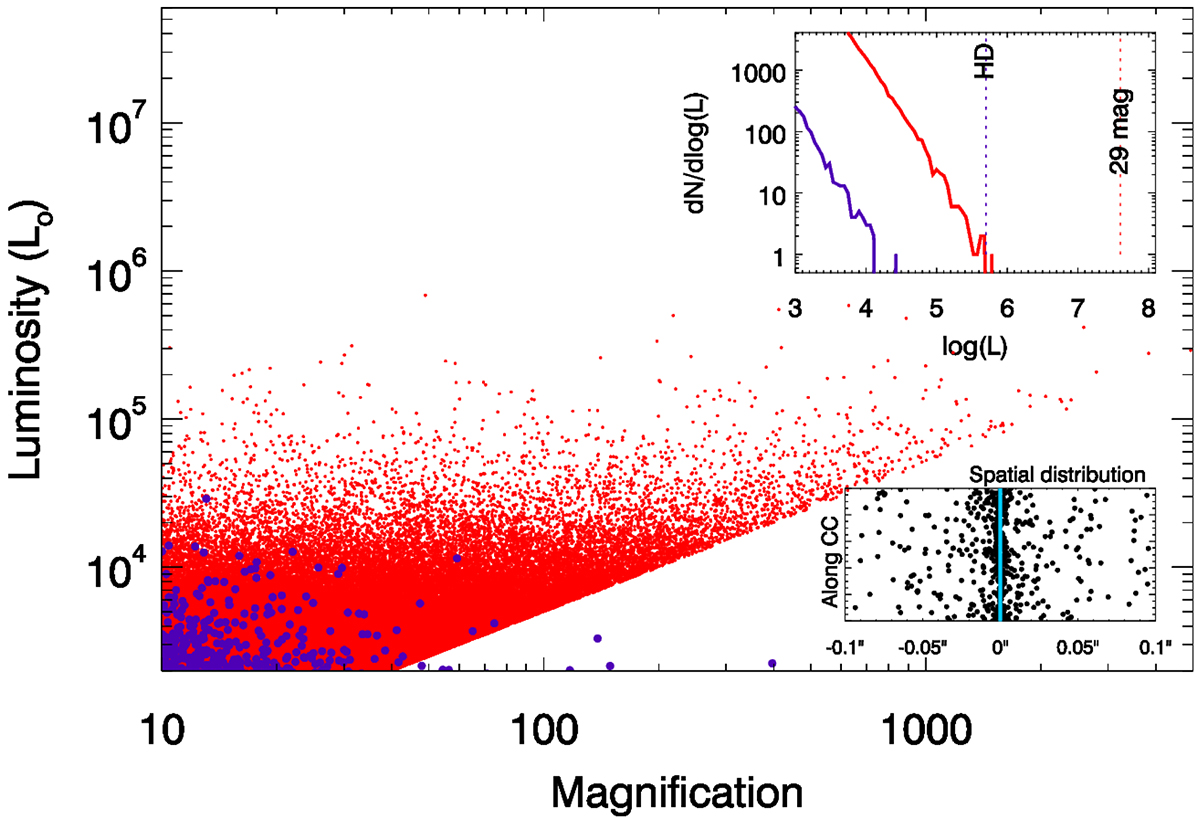
Similar to Figure 9 but for the case where β = 3. In this case, all magnifications have comparable probability as predicted by Equation 11. The lensed LF (thick red line) lies a factor of ![]() above the nonlensed LF (blue line). The smaller number of events at high luminosity when compared to Figure 9 is due to the fact that the number of stars in the simulation is the same in both cases, but for the steeper LF there are more stars with lower luminosities. The number density if events concentrates around the CC, tracing the magnification.
above the nonlensed LF (blue line). The smaller number of events at high luminosity when compared to Figure 9 is due to the fact that the number of stars in the simulation is the same in both cases, but for the steeper LF there are more stars with lower luminosities. The number density if events concentrates around the CC, tracing the magnification.
Current usage metrics show cumulative count of Article Views (full-text article views including HTML views, PDF and ePub downloads, according to the available data) and Abstracts Views on Vision4Press platform.
Data correspond to usage on the plateform after 2015. The current usage metrics is available 48-96 hours after online publication and is updated daily on week days.
Initial download of the metrics may take a while.