Fig. 13.
Download original image
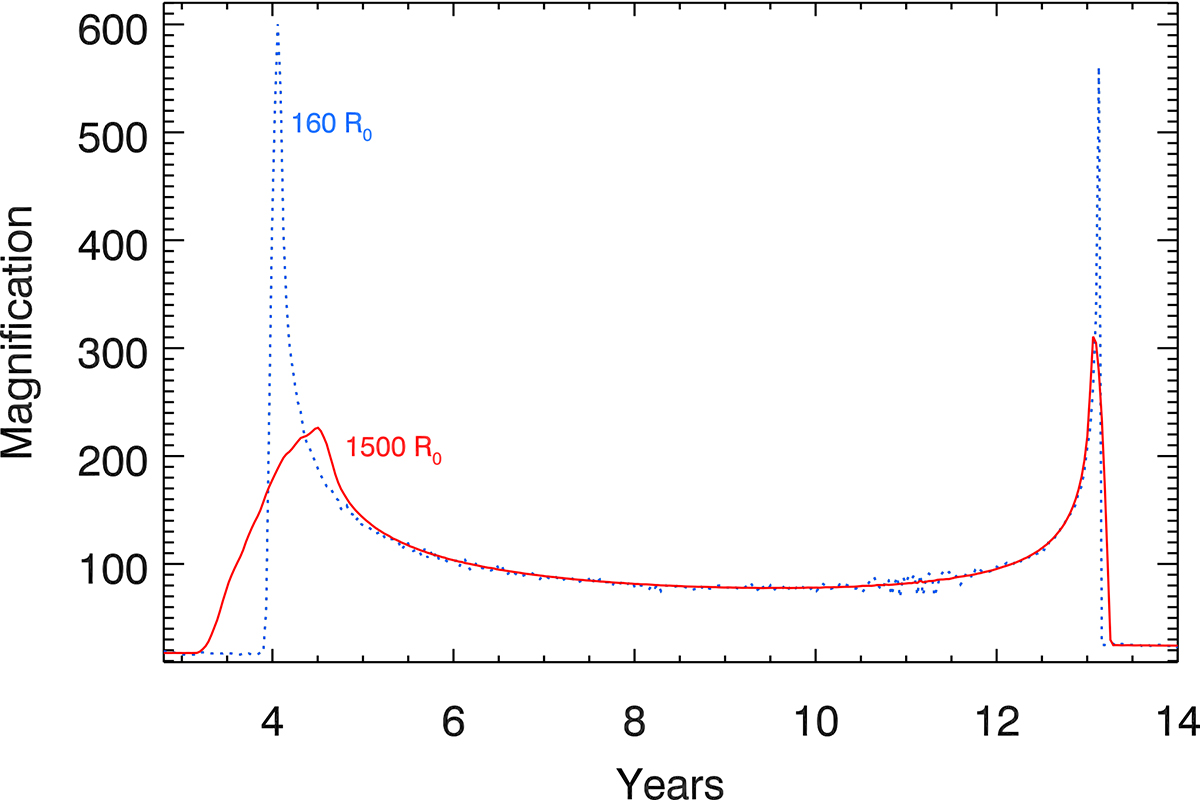
Light curve of a star moving at 500 km s−1 along the track shown in Figure 12. The blue dotted line corresponds to a star with the same diameter as the pixel of the simulation (320 R⊙), while the red solid line corresponds to a much larger and more luminous star with R = 1500 R⊙. The star crosses the entire caustic region in ∼9 yr, with the first peak grazing the caustic and producing a wide peak.
Current usage metrics show cumulative count of Article Views (full-text article views including HTML views, PDF and ePub downloads, according to the available data) and Abstracts Views on Vision4Press platform.
Data correspond to usage on the plateform after 2015. The current usage metrics is available 48-96 hours after online publication and is updated daily on week days.
Initial download of the metrics may take a while.