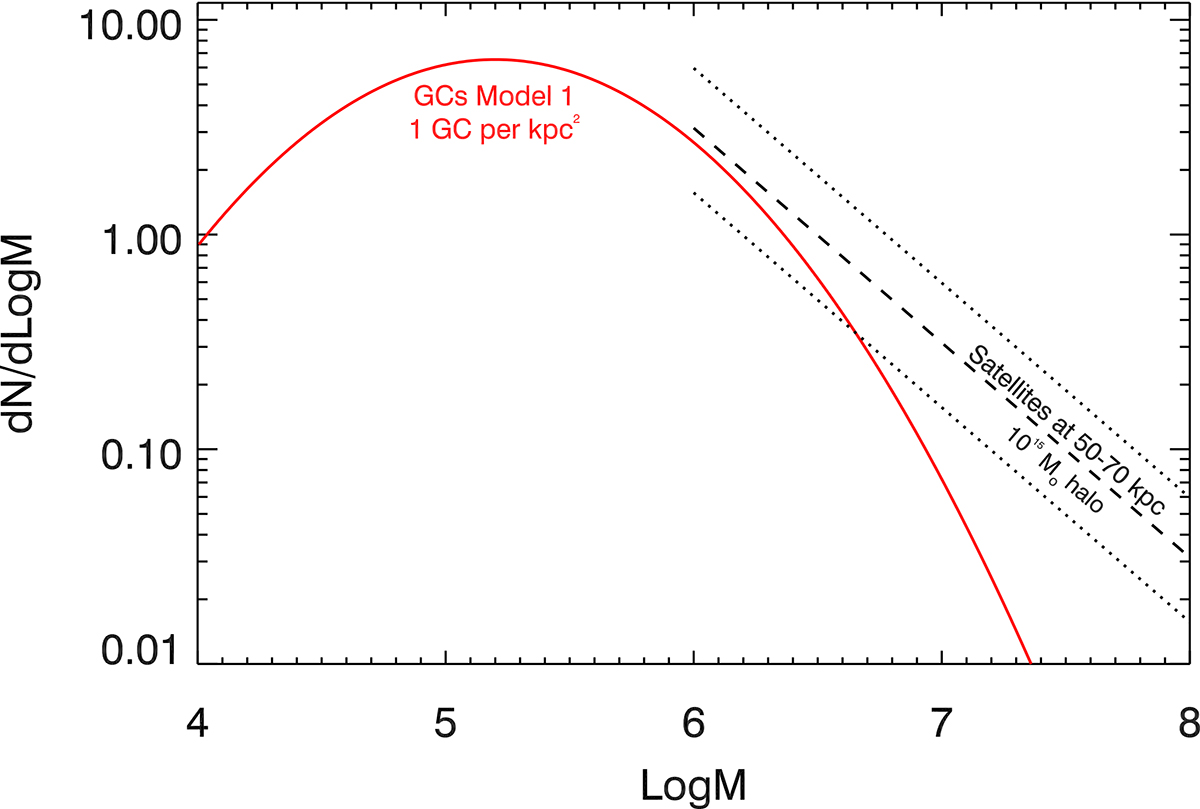
Fig. 14.
Download original image
Comparison of mass functions of GCs and satellites. The red solid line shows the total number of GCs in the area corresponding to the Dragon arc from the GC mass function, after normalizing it to a density of 1 GCs per kpc2. The black dashed line shows the mass function from N-body simulations of a population of satellites in a cluster with Mvir = 1015 M⊙ and computed in a similar area at distances between 50 and 70 kpc from the center of the halo (same distance of the Dragon arc). The dotted lines shows the dispersion in the number of satellites from 16 different realizations. In most realizations, no halos more massive than ∼108 M⊙ are found within the region considered. The total mass from the GC mass function is 4.01 × 10⁸ M⊙ and the total mass from the satellite mass function is 3.07 × 10⁸ M⊙. Finally, the sum of mass from the GC mass function up to 106 M⊙ and the mass from the satellite mass function above 106 M⊙ is 5.01 × 10⁸ M⊙.
Current usage metrics show cumulative count of Article Views (full-text article views including HTML views, PDF and ePub downloads, according to the available data) and Abstracts Views on Vision4Press platform.
Data correspond to usage on the plateform after 2015. The current usage metrics is available 48-96 hours after online publication and is updated daily on week days.
Initial download of the metrics may take a while.