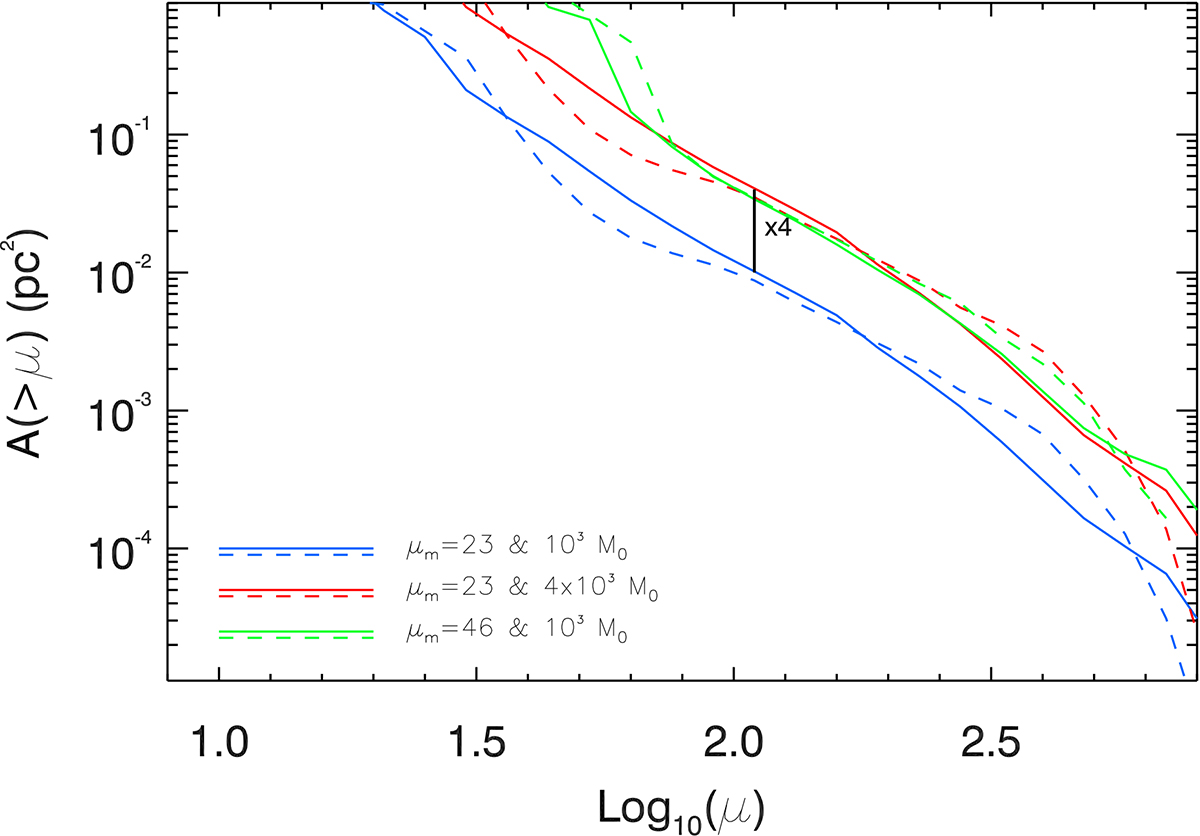
Fig. 5.
Download original image
Scaling of probability of magnification. The curves show the area in the source plane with magnification greater than a certain value due to millilenses in the lens plane. Solid lines are for millilenses in regions of the lens plane where the macromodel magnification is positive (positive parity), while dashed lines are for millilenses in regions of the lens plane with negative macromodel magnification (negative parity). Blue curves are for a millilens with mass 103 M⊙ and macromodel magnification ±23, red curves are for millilenses with mass 4 × 10³ M⊙ and macromodel magnification ±23. Green curves are for a millilens with mass 103 M⊙ and macromodel magnification ±46. The black vertical line indicates a factor of four difference. The probability of magnification scales linearly with the mass of the millilens and quadratically with the macromodel magnification.
Current usage metrics show cumulative count of Article Views (full-text article views including HTML views, PDF and ePub downloads, according to the available data) and Abstracts Views on Vision4Press platform.
Data correspond to usage on the plateform after 2015. The current usage metrics is available 48-96 hours after online publication and is updated daily on week days.
Initial download of the metrics may take a while.