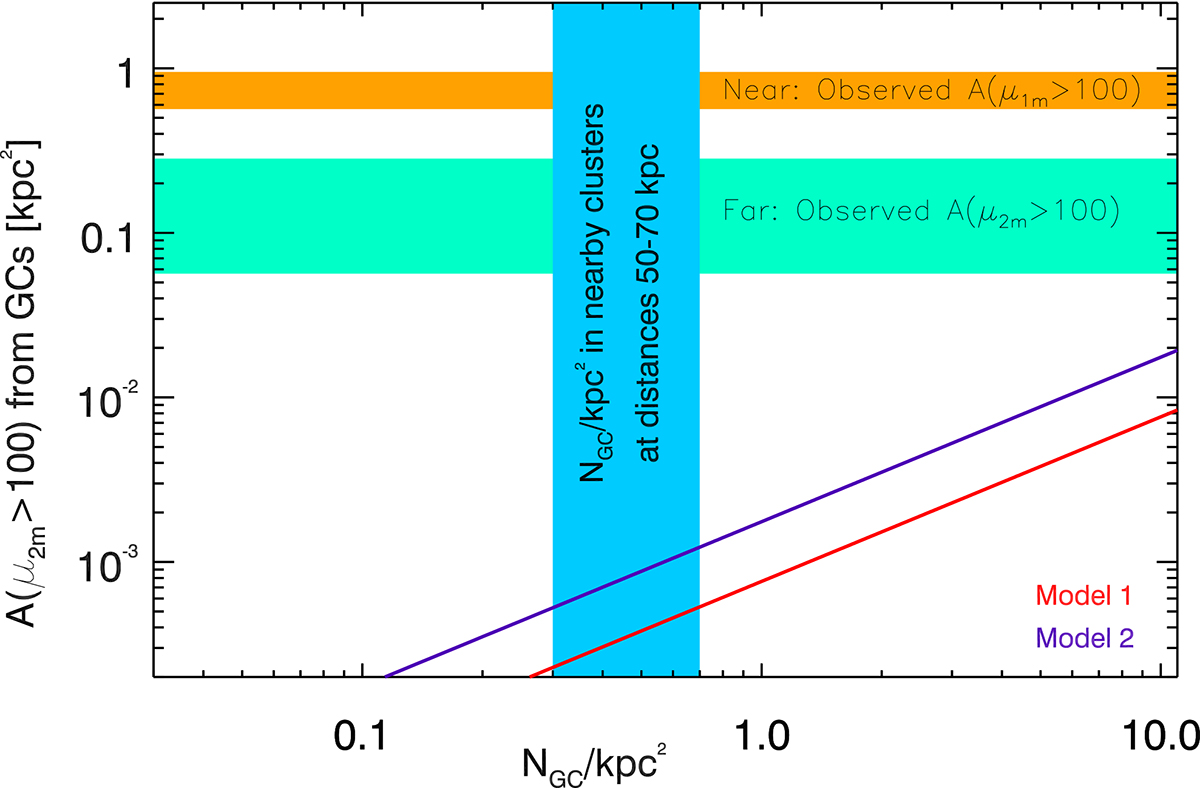
Fig. 7.
Download original image
Expected and observed area in the source plane with magnification μ > 100. The red and blue solid lines show Afar(μ2m > 100), the expected area in the source plane with magnification greater than 100 around millilenses in the far region for the two different mass functions shown in Figure 6. This area is computed as a function of the number density of millilenses, NGC, and later rescaled to the area in the far region (960 kpc2). The blue vertical band shows the typical range of number density of GCs at the distance of the Dragon arc from nearby clusters. The horizontal orange band shows Anear(μ1m > 100), the area in the source plane with macromodel magnification μ1m > 100. The green horizontal band represents the fraction of microlensing events found in the far region with respect to the near region (∼0.1 to 0.5 times the number of events found in the near region).
Current usage metrics show cumulative count of Article Views (full-text article views including HTML views, PDF and ePub downloads, according to the available data) and Abstracts Views on Vision4Press platform.
Data correspond to usage on the plateform after 2015. The current usage metrics is available 48-96 hours after online publication and is updated daily on week days.
Initial download of the metrics may take a while.