Fig. 9.
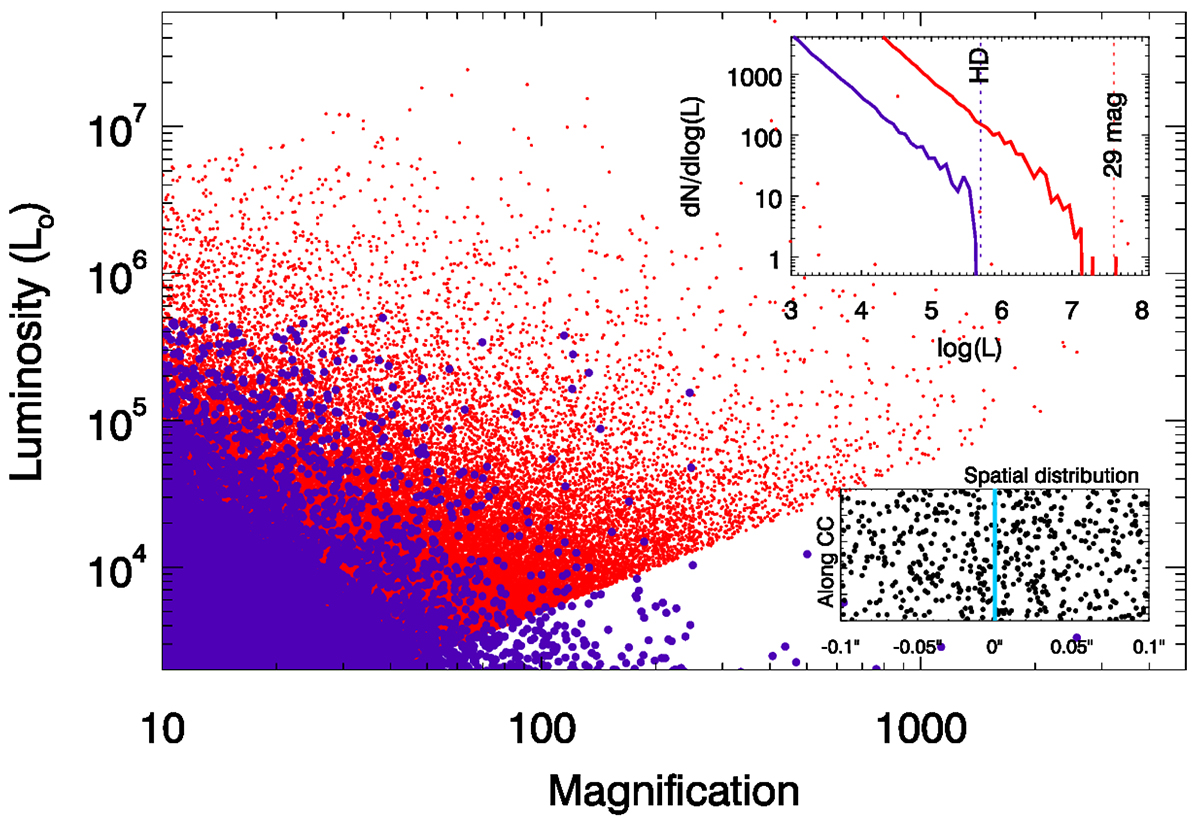
Download original image
Monte Carlo realization of lensed stars for a case with β = 2. For this example, half a million stars with luminosities in the range 50 L⊙ < L < 5 × 10⁵ L⊙ are placed in a region with magnification μ3m > 10. The maximum luminosity corresponds to the observed HD limit for supergiant stars in the local universe Humphreys (1978). The diagonal cut in the red points is just Lobs = 50 × μ L⊙. The simulation is complete above Lobs ≈ 106 L⊙. The LF of stars has a slope of β = 2. Blue dots represent stars before magnification and red dots are the magnified stars. In the top-right inset we show the LF of the stars before magnification (blue curve) and the observed LF after magnification (red curve). In the bottom-right inset we show the spatial distribution of the 500 brightest events and for a model with magnification μ = 1″/d where d is the distance to the CC (marked with a vertical light blue line at d = 0″) in arcseconds.
Current usage metrics show cumulative count of Article Views (full-text article views including HTML views, PDF and ePub downloads, according to the available data) and Abstracts Views on Vision4Press platform.
Data correspond to usage on the plateform after 2015. The current usage metrics is available 48-96 hours after online publication and is updated daily on week days.
Initial download of the metrics may take a while.