Fig. 1
Download original image
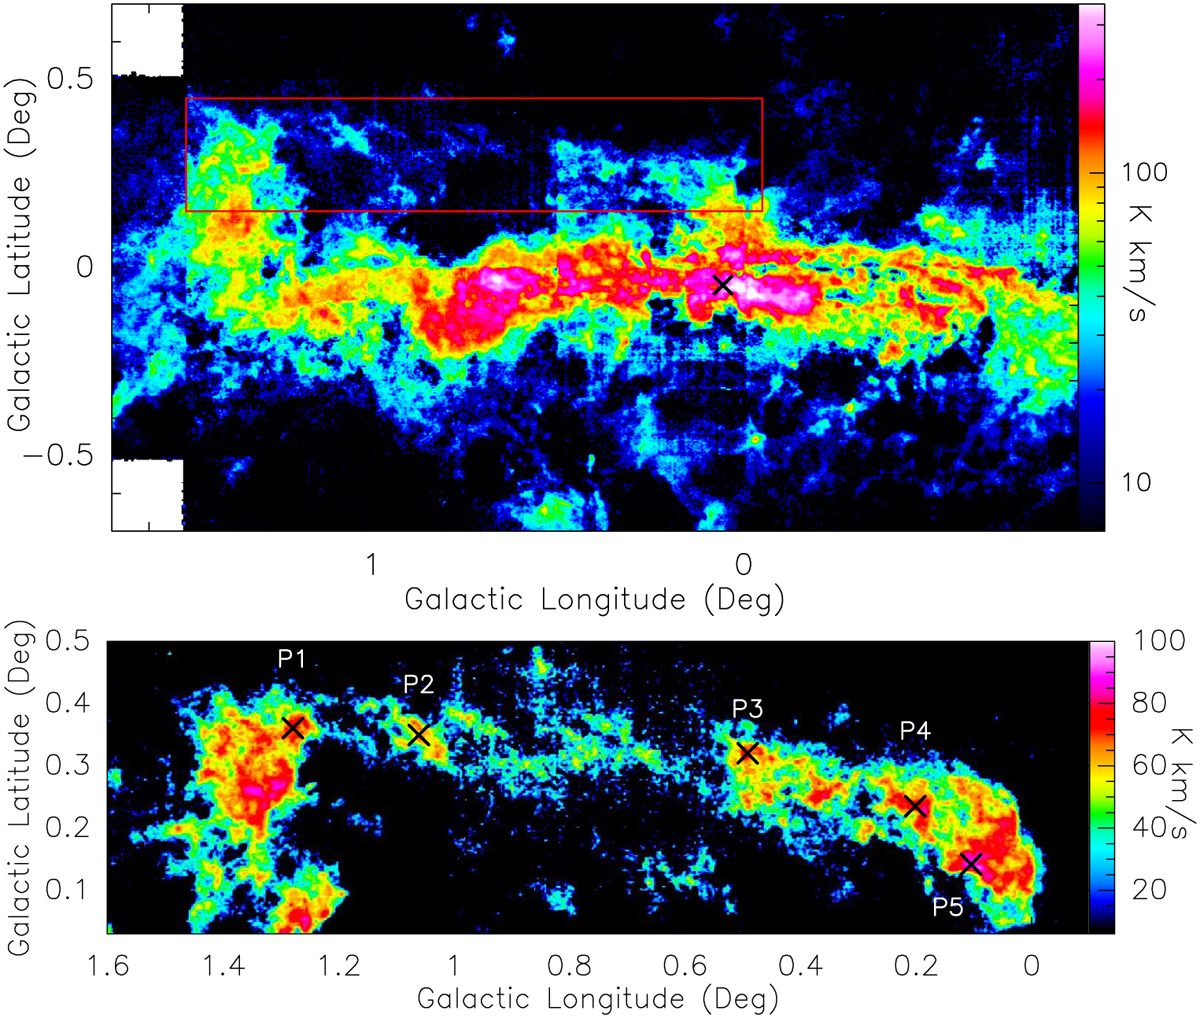
13CO (2–1) integrated intensity maps from the SEDIGISM survey. (Top) Integrated intensity map in the velocity range −200 to +200 km s−1. The box in red indicates the area containing the high velocity stream (right panel) and × marks the positions of Sgr A*. (Bottom) Integrated intensity map of the high velocity stream in the velocity range +100 to +200 km s−1. The five positions used for SiO observations are marked as × and are labelled.
Current usage metrics show cumulative count of Article Views (full-text article views including HTML views, PDF and ePub downloads, according to the available data) and Abstracts Views on Vision4Press platform.
Data correspond to usage on the plateform after 2015. The current usage metrics is available 48-96 hours after online publication and is updated daily on week days.
Initial download of the metrics may take a while.