Fig. 11
Download original image
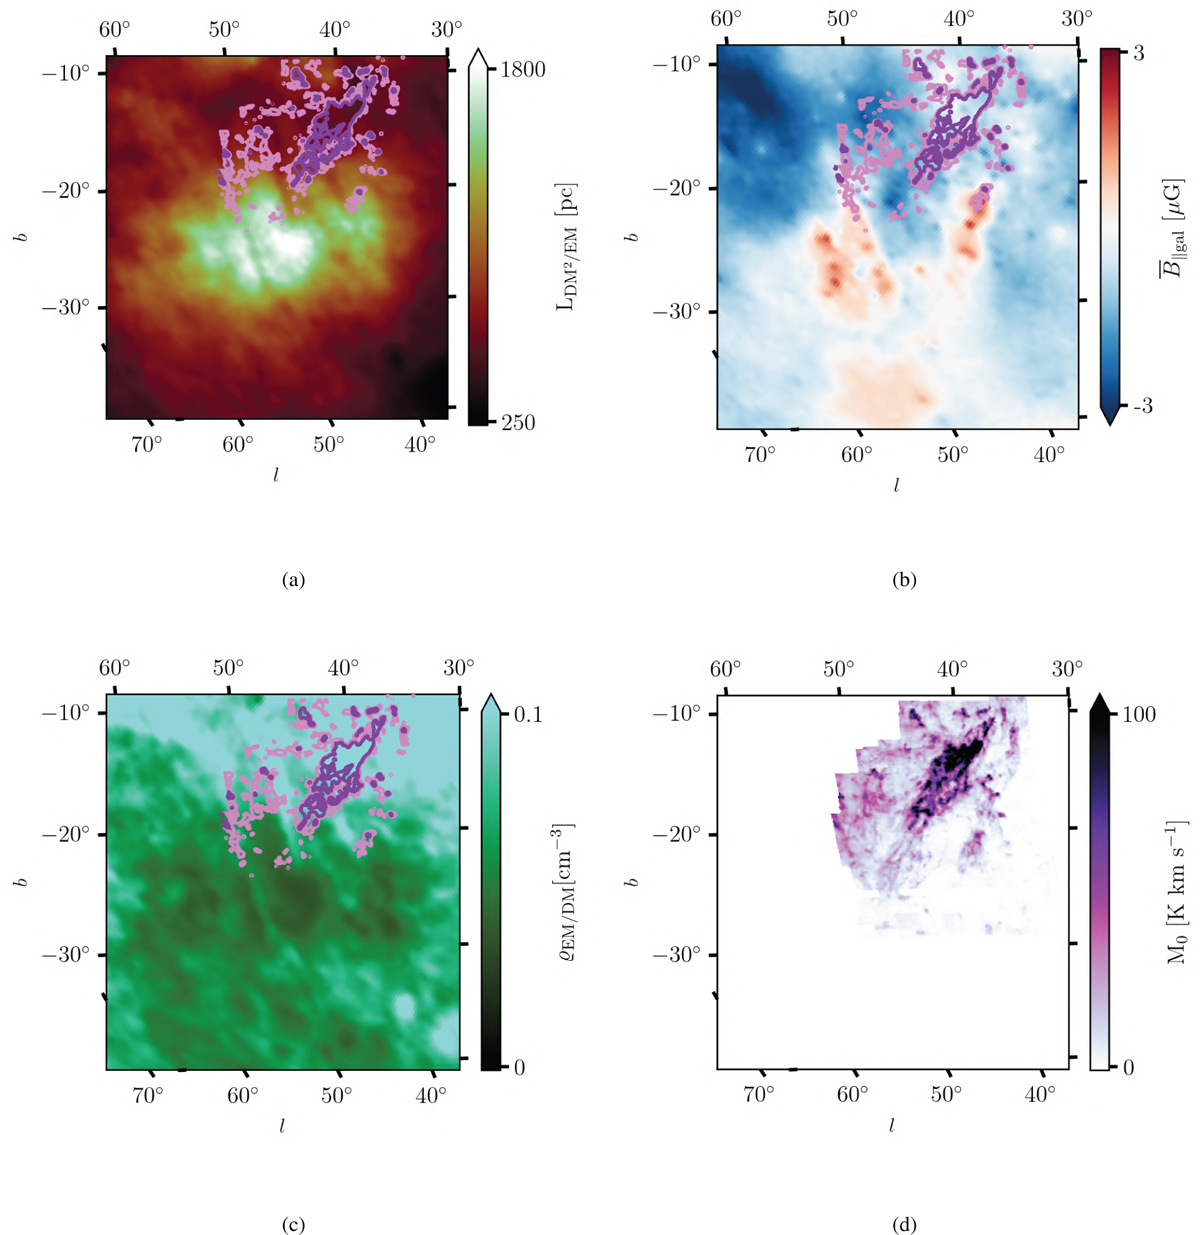
Cutouts of several sky maps toward the Smith HVC. The images show a) ![]() , b)
, b) ![]() , c) ρEM/DM, and d) velocity-integrated HI observed by Justify the Green Bank Telescope (Lockman et al. 2008). Contours of the HI data are plotted over the first three images, with contour lines set at 30 K km s−1 (light violet) and 60 K km/s (dark violet).
, c) ρEM/DM, and d) velocity-integrated HI observed by Justify the Green Bank Telescope (Lockman et al. 2008). Contours of the HI data are plotted over the first three images, with contour lines set at 30 K km s−1 (light violet) and 60 K km/s (dark violet).
Current usage metrics show cumulative count of Article Views (full-text article views including HTML views, PDF and ePub downloads, according to the available data) and Abstracts Views on Vision4Press platform.
Data correspond to usage on the plateform after 2015. The current usage metrics is available 48-96 hours after online publication and is updated daily on week days.
Initial download of the metrics may take a while.