Fig. 2
Download original image
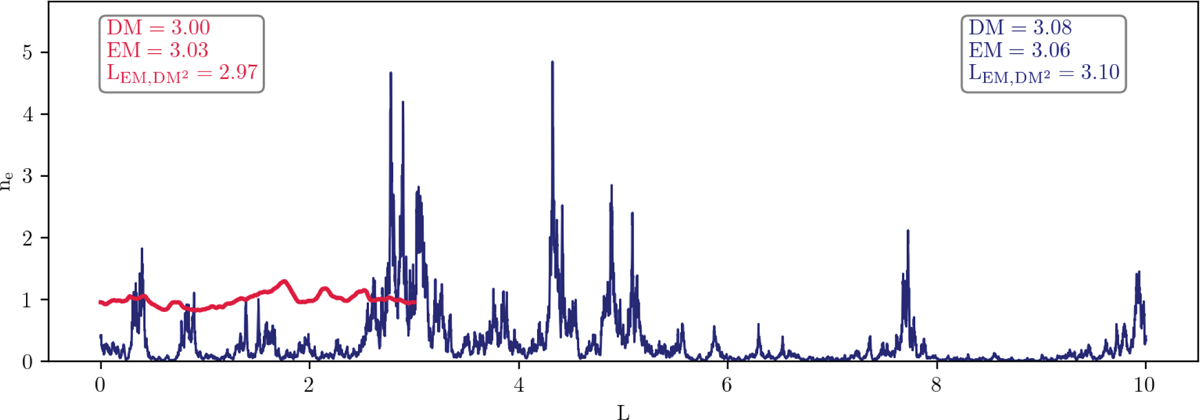
Illustration of the EM-DM relation for two simple models, discussed in Sect. 2.3.1. The red graph shows a short LoS with relatively weak variations in ne, while the blue one shows a long LoS with strong variations. Albeit depicting two completely different environments, the calculated DM, EM, and ![]() values for an observer sitting at L = 0 approximately agree. The units in this illustration are arbitrary, as the effect is scale-invariant. Its main intention is to demonstrate the interpretational limitations of Eq. (11). A more physical illustration of the Milky Way is provided later in Sect. 4.1.3.
values for an observer sitting at L = 0 approximately agree. The units in this illustration are arbitrary, as the effect is scale-invariant. Its main intention is to demonstrate the interpretational limitations of Eq. (11). A more physical illustration of the Milky Way is provided later in Sect. 4.1.3.
Current usage metrics show cumulative count of Article Views (full-text article views including HTML views, PDF and ePub downloads, according to the available data) and Abstracts Views on Vision4Press platform.
Data correspond to usage on the plateform after 2015. The current usage metrics is available 48-96 hours after online publication and is updated daily on week days.
Initial download of the metrics may take a while.